During operation, several stresses are brought to bear upon key components of the motor. An air gap eccentricity results in increasing these stresses during operation. A motor operated with an eccentric air gap results in increased mechanical vibration, accelerated insulation degradation due to increased coil movement, and possible rotor/stator rubbing due to unbalanced magnetic pull. Types of air gap eccentricity are:
Static Eccentricity - which occurs when the centerline of the shaft is at a constant offset from the centerline of the stator. An example is a misaligned end bell.
Dynamic Eccentricity - which occurs when the centerline of the shaft is at a variable offset from the centerline of the stator, such as a wiped bearing.
Failure Mechanisms
By definition, air gap eccentricity is a mechanical fault with the motor. There are several possible causes for the presence of variances in the distance between a rotor and a stator. The five basic types of air gap eccentricities that can occur are:
•Rotor O.D. is eccentric to the axis of rotation
•Stator bore is eccentric
•Rotor and stator are round, but do not have the same axis of rotation
•Rotor and shaft are round, but do not have the same axis
•Any combination of the above
The following are only a few of the possible causes of an air gap eccentricity:
•Improper mounting of the motor to its bedplate can lead to an air gap distortion. A loose or missing bolt allows shifting of the motor's mounting foot during thermal expansion of the frame. This shifting over time could lead to a distortion of the frame and possible distortion of the stator bore. The common term for a motor incorrectly mounted is "soft-foot."
•During construction of the motor, out-of-roundness of either the rotor or stator will lead to an air gap eccentricity. Industry standards recommend that measurements for total indicated roundness (TIR) should be performed at different locations along the length of each of these components. Couple these measurements with the circumferences of each component, and depending on the speed and size of the motor, there are recommended tolerances from 5 to 20 percent variation in the air gap.
•Eccentricity can develop due to improper tensioning of drive belts coupled to a motor. One customer working with PdMA's technical support staff said that while they were releasing the tension on one set of belts, they measured the deflection of the motor shaft, only to find it had moved 1/8 an inch! Improper alignment could also lead to a situation similar to this with both leading to a bowing of the rotor during operation.
•Distorted end bells, cocked bearings, or a bent shaft will all cause an air gap eccentricity. During the manufacturing of the rotor, uneven mechanical stresses could be introduced into the cage and lamination stack leading to bowing of the completed rotor.
•An air gap eccentricity results in increased levels of vibration due to the uneven magnetic pull it creates between the circumference of the rotor and stator bore. Over time, these elevated levels of vibration can result in excessive movement of the stator winding, which could lead to increased friction and eventually a turn-to-turn, coil-to-coil, or ground fault. Increases in mechanical vibration accelerate bearing failure, which could seize the shaft and overheat the windings or allow additional movement of the shaft leading to a rotor/stator rub. The uneven magnetic stresses applied to the rotor, coupled with the increased vibration, will also contribute to mechanical looseness developing in the rotor assembly. Risk of rotor pull-over increases exponentially with the amount of air gap eccentricity.
•Rotor pull-over is an example of rotor/stator rub that appears as random marks on both the stator bore and surface of the rotor. Pull-over describes the bending of the motor shaft allowing the rotor to come into contact with the stator. Pull-over most often occurs during start up when the magnetic forces pulling on the rotor are greatest. The magnetic pull acting upon the rotor varies as the square of the difference in the air gap (Figure 1). For example, when the air gap at the narrowest point between the rotor and the stator is one half that of the air gap at its widest, the magnetic force at the narrowest will be four times stronger than the widest point. Couple that with the in-rush current and the magnetic pull could flex the shaft leading to a rotor/stator strike.

Analysis
Testing a motor for air gap eccentricity can be easily accomplished using Motor Circuit Analysis (MCA) or Current Signature Analysis (CSA). The hardest part seems to be deciding what to do about it, after confirming that an air gap eccentricity exists. When performing CSA there is no absolute standard on how much eccentricity indicated on a current spectrum is too much. The same can be said for the results of a Rotor Influence Check (RIC). The graph may indicate the presence of an air gap eccentricity, but without historical results for comparison you really cannot develop a sense of how much eccentricity has developed and if it is getting worse with time.
MCE Analysis
Motor Circuit Analysis utilizes a combination of phase-to-phase resistance and inductance measurements to detect abnormalities in the motor's winding, rotor, and air gap. Positioning the rotor in specific mechanical increments and graphing the phase-to-phase inductance values results in a graph www.uptimemagazine.com 39 that allows air gap eccentricity analysis.
Air gap evaluation with the MCE is accomplished utilizing the Rotor Influence Check (RIC) test. The RIC is a graphical representation of the magnetic coupling between the rotor and the stator. The RIC test will be most successfully applied in troubleshooting and determining a course of action if pre-existing RIC data is available. However, even without a baseline test, the RIC test will give you definite indications of existing eccentricity.
The RIC test is conducted by positioning of the rotor in incremental steps through one or more pole groups and recording each of the three phase-to-phase inductance values at each increment. These readings of inductance are graphed allowing for analysis of the motor's winding, rotor, and air gap.
A pole group is the amount of mechanical movement of the rotor required to produce a 360-degree sine wave of the stator winding inductance values. For example, in a four-pole motor, the rotor would need to be positioned incrementally through 90 degrees mechanically to complete a 360-degree electrical sine for each of the three phases.

Figure 2 is an example for a two-pole motor. The rotor was positioned mechanically 180 degrees producing a 360-degree sinusoidal graph of inductance.
Analysis of phase-to-phase inductance for air gap eccentricity focuses on: Alignment, Minimum & Maximum Peak-to-Peak Inductance over two or more pole faces and Inductive Imbalance.
Alignment: Is there a level alignment of the graph across the chart?
To determine if the motor has an eccentricity in the rotor/stator air gap, evaluate the alignment of the RIC graph. Unevenness in the space between the rotor and stator will affect the alignment of the Rotor Influence Check (RIC) as the rotor is positioned during the test. An uneven alignment such as what is seen in Figure 3 indicates eccentricity exists between the rotor and stator. The more severe the air gap eccentricity, the greater the misalignment. Comparison to a previous RIC test allows for determining if the condition is worsening over time.
Peak-to-Peak Inductance: What are the minimum and maximum inductance values?
When air gap eccentricities exist in a motor, peak-to-peak inductance values for each individual phase will vary from one pole face to the next. To see this change in peak-to-peak inductance values, position the rotor through at least two pole faces. Figure 4 on the following page demonstrates how the peak-topeak inductance values vary from one pole group to another for an individual phase when there is an air gap eccentricity.

Remember, in a concentric wound motor each individual phase will have it's own minimum and maximum inductance values. An example of how a concentric wound motor develops uneven minimum and maximum inductance values between individual phases is shown later in this article.
Inductive Imbalance
Inductive Imbalance is a percentage calculated by dividing the average of the three phase-to-phase inductance readings into the value of the individual phase-to-phase inductance furthest from the average and multiplying by 100. With the rotor removed from a threephase motor this imbalance is expected to be less than 1%. With a rotor installed this value varies and is determined by design considerations such as rotor skew, design air gap, and other factors that affect rotor/stator geometry. For a motor in satisfactory condition, this imbalance remains within a plus or minus window of 2 for any rotor position. Some motors may be 5.5% to 7.5%, for example. When performing a RIC, at the end of positioning the rotor through one pole face, check the highest and lowest calculated imbalance. If the difference is greater than 2%, positioning the rotor through a second pole face is recommended.
Concentric vs. Lap Wound
An important consideration when evaluating RIC data for indication of eccentricity is whether the motor is concentric or lap wound. If a motor is concentric wound, it may be built with a pre-existing offset between the stator windings and the rotor.
The concentric wound motor illustrated in Figure 5 has the stator windings inserted into the stator slots in a basket form or stacked configuration. Commonly all of the pole groups for phase A are laid into the slots, then all of the pole groups for phase B, then finally all of the pole groups for phase C. This results in a greater distance between the rotor and the phase A coils than exists between rotor and phase C coils. This results in a natural stair stepping indication of the phase-to-phase values seen in Figure 8.

Standard lap wound motor windings, which have each coil of every phase equally lapped over the surrounding coils, results in the three phases having equal high/low inductance vales.
How does a person identify a concentric or lap wound motor? There are only two absolute methods. One is by taking the end bell off and looking. The other is obtaining the information directly from the manufacturer. However, here are some rules of thumb that should help you distinguish between the two.
1.If it is new and smaller than 50hp, it is very likely concentric wound.
2.If it exhibits the pattern seen in Figure 8, it is very likely concentric wound.
3.If it has been rewound at any size, it may be lap wound.
Note: These are not absolute, as several manufacturers design medium and high voltage concentric wound machines.
Figures 6 and 7 clearly illustrate the way windings are placed in a concentric wound stator. Note the different depths and locations of the coil groupings.

Due to design, concentric wound motors create RIC results that appear as though there may be an air gap eccentricity when the rotor is only positioned through a single pole face. Results of a RIC performed on a concentric wound motor can be seen in Figure 8. Notice on the blue phase indicator, that the peak amplitudes from one pole group to another are essentially the same, but different from the other two phases. The blue phase is always slightly lower than the red phase, but higher than the green phase.

In a case where concentric wound motors are identified or suspected, the RIC needs to be performed over two pole faces. Place the motor in observe and confirm any suspected eccentricity with correlating evidence, such as EMAX eccentricity analysis or vibration analysis.
Figure 9 shows an example of dynamic eccentricity. Notice how the peak amplitudes of the blue phase vary from pole group to pole group as the rotor is rotated. This is occurring for each of the three phases. Dynamic eccentricity is the more severe type of eccentricity due to the increased chance of a rotor/stator rub due to rotor pull-over.

To determine the severity of an eccentricity problem identified with the MCE, it is important to correlate with other technologies, which analyze the motor while it is in a dynamic condition. If the eccentricity is affecting the running characteristics, such as high eccentricity sidebands in the current spectrum of EMAX and higher than acceptable vibration levels at twice line frequency, then action should be taken to correct the eccentricity as soon as possible. If eccentricity is not evident in the RIC test with the motor de-energized, but the running tests do indicate eccentricity, then soft foot should be the first thing investigated.
EMAX Analysis
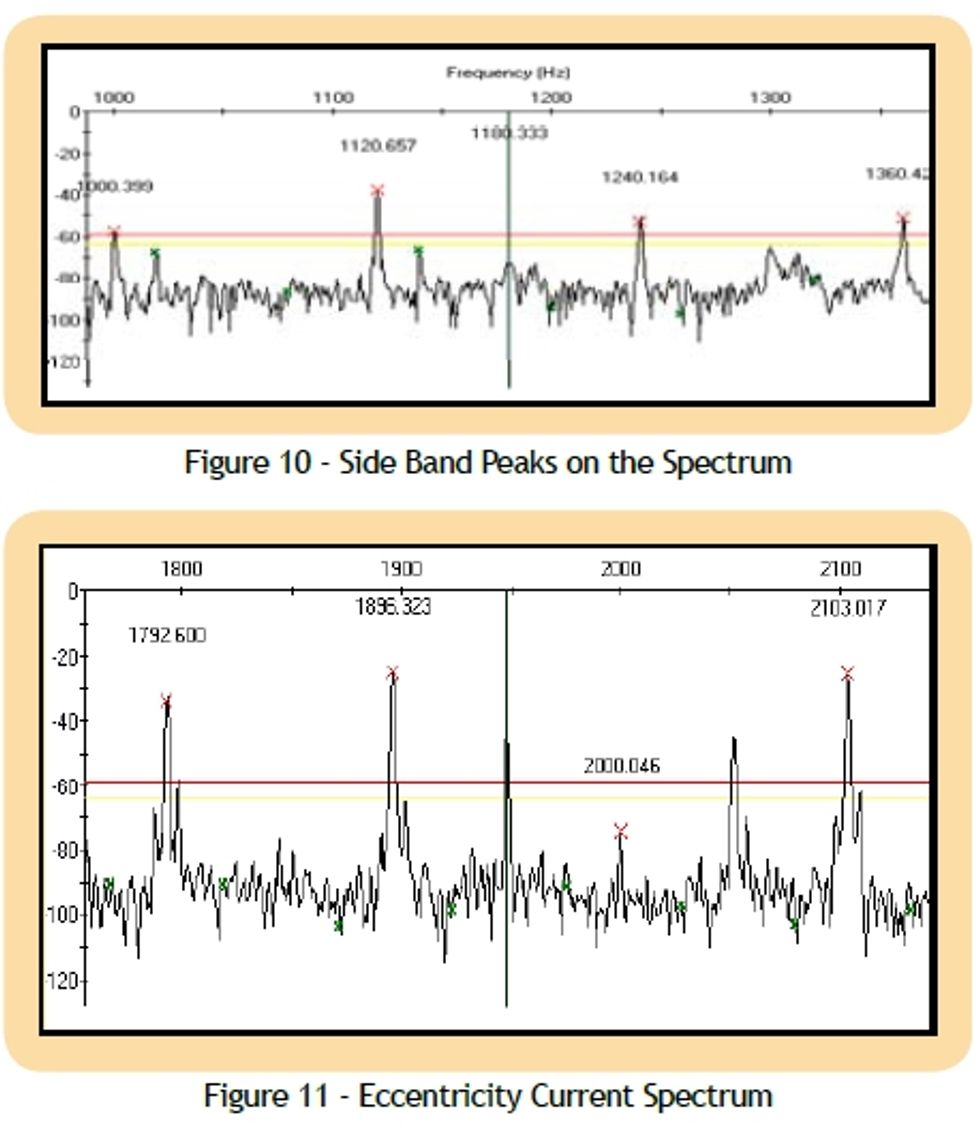
Eccentricity analysis using EMAX technology is performed through a high frequency spectrum of current signature analysis. When air gap eccentricity exists in a motor, the air gap flux will be off balance, causing different levels of voltage to be induced onto the rotor. This results in irregular current flow on the rotor and varying levels of counter electromotive force, which is felt by the stator. These varying forces on the stator winding produce changes in the amplitude of the current similar to a load change. By displaying the current in a spectrum format, the modulations can be seen as sideband activity around a location known as the Eccentricity Frequency (FECC). The FECC is the number of rotor bars multiplied by the shaft frequency (RPM/60) of the motor. The current modulations are seen as peaks on the spectrum, which will be odd multiple sidebands of the line frequency powering the motor. In a 60 Hz system, the 1st and 3rd sidebands will appear as 4 peaks, 120 Hz apart, and non-synchronous to line frequency. These peaks are seen in Figure 10.

One advantage the EMAX offers when performing CSA is that the technician may use alarm set points to estimate the severity of the eccentricity and act accordingly. However, speed and rotor bar information is necessary for the technician to be able to confirm that the peaks identified on the spectrum are indeed eccentricity related. If the number of rotor bars and the speed are known, the MCEGold and WinVis software automatically places a red X at the four peak locations that identify eccentricity. Obtaining the speed from the Advance Spectral Analysis (ASA) current demodulation software, Low/High Resolution rotor tests, or via a strobe light is the easy part. The rotor bar count, however, is another matter. First, at the earliest opportunity you should verify that a rotor bar count request exists on each of your motor repair specifications. The report you get back from the shop should include how many rotor bars and stator slots exist in the motor. Second, utilize the vibration department to assist in the rotor bar count. They may have previously identified the number of rotor bars through spectrum analysis of the vibration signal. If neither of these methods work, reverse calculation as described later in this article may be required.
One of the most often overlooked tools is the caution and alarm set points, which are preprogrammed into the software. We often get information sent in for review on possible eccentricity and neither the eccentricity related peaks, nor any other peak for that matter, is close to the yellow caution line. Also remember when dealing with a VFD, no longer does 60 Hz line frequency necessarily apply. If the drive is operating at 40 Hz, rather than four peaks 120 Hz apart, you are now looking for four peaks 80 Hz apart and nonsynchronous to 40 Hz rather than 60 Hz. The MCEGold and WinVis auto frequency adjusts automatically and corrects for VFDs, and it will correctly identify peaks based on the measured fundamental frequency, as seen in Figure 11.
Whether across the line or powered from a VFD, if speed is known, but the number of rotor bars is unavailable, the following information will assist you in analyzing the eccentricity test's frequency spectrum. Eccentricity related peaks usually exist between 600 Hz and 2000 Hz on the current spectrum. This frequency range is based on the fact that the eccentricity peaks are odd multiple sidebands of the line frequency around the product of the number of rotor bars and the speed of the shaft (# of rotor bars x shaft speed). Commonly, the faster the motor, the lower the number of rotor bars. The slower the motor, the higher the number of rotor bars. When multiplied, the product is usually less than 2000 Hz. However, larger two pole motors may exceed the 2000 Hz mark. Eccentricity peaks cannot be harmonics of line frequency. As a result of slip being involved, the calculation of eccentricity prevents it mathematically from being a multiple of the line frequency. Therefore, running the harmonics marker, which places a small green x at each of the line frequency harmonic peaks, allows you to quickly remove the identified peaks from the suspect list. Line frequency harmonics are very common and often can look like eccentricity peaks.
If in a 60 Hz system you identify that four or more peaks exist between 600 and 2000 Hz,
which are 120 Hz apart and non-synchronous to line frequency, you can reverse calculate the number of rotor bars by highlighting the 2nd of the four peaks and clicking the estimate bars button on the screen. When using this feature to estimate the number of rotor bars you should always include a note with the test stating that the numbers of rotor bars is an estimate only until you can confirm the actual number of bars.
MCEMAX Helpful Hints
Rotor Influence Check
•Slow motors require testing an additional pole face. When testing a slow speed motor, remember one pole face could equate to positioning the rotor 30 degrees or less. If there is an air gap eccentricity, a RIC, which only covers one pole face, will not have enough of a change mechanically in the rotor/stator relationship to cause the inductance readings to vary much, if at all.
•Use the balance of inductance to determine if you should continue the test. The graph of inductance imbalance is produced during the RIC test to aid the operator in determining if a second pole face should be completed. If the balance of inductance changes by 2 or more, a second pole face should be performed. The extra data will facilitate the data interpretation.
Eccentricity Test
•For VFD powered motors, strobe/tach speed. The added difficulty in determining the speed of a VFD powered motor from the High/Low Resolution or ASA means it is always better to be absolutely sure of motor speed. An external tachometer or strobe should be used to confirm speed and if the number of bars is known, the data analysis becomes automatic.
•The X16 scale will fit 4 peaks. When manually searching (scrolling down from the higher frequency of the spectrum) the X16 scale display of the spectrum will give you just enough "window" to see four peaks 120 Hz apart. Keep this in mind and the manual search will become quicker.
Summary
Eccentricities in the air gap will develop uneven magnetic pull between the stator and rotor during operation. This uneven magnetic pull will lead to increased vibration, mechanical wear and tear, and possibly pull-over to the point of a rotor/stator rub. It is important to have equipment that provides you with the necessary information to make informed maintenance decisions concerning the severity of an air gap eccentricity. With the MCE RIC test and the EMAX eccentricity high frequency spectral analysis test, the MCEMAX provides one easy to operate package for comprehensive evaluation of air gap eccentricity during operation or when the motor is secured.