The current low oil market environment has forced many producers to look into efficient and cost-effective ways to do business. Therefore, it becomes the responsibility of every engineer involved in the oil and gas sector, or any industry for that matter, to come up with innovative ways to analyze, understand and resolve problems plaguing their respective disciplines without incurring excessive costs.
The Hydraulic Institute published the ANSI/HI9.6.7 standard in 2010 de-tailing the effects of liquid viscosity on rotodynamic pump performance. The new standard built on and improved some of the concepts covered in the previous procedure. While there are many references available on the differences, it is worth noting that the new procedure provides a mathematical framework to analyze and correct pump performance due to fluid viscosity variation in contrast to the previous procedure, which only provided a graphical means to perform such corrections. These equations enable a rotating equipment engineer or process engineer to use spreadsheet software and/or various other tools to evaluate, rerate and troubleshoot centrifugal pump issues. An exercise that can prove fruitful in both the operational and project selection stages of engineering would be to evaluate the effects of higher viscosity fluids on pump performance, temperature and its potential impact on the reliability of the machine using basic tools prior to going out for a pump bid or providing feedback during a root cause analysis session.
Consider the case of an API 610 between bearings two-stage centrifugal pump that has been performance tested on water and the performance curves subsequently provided by the vendor. These curves can be recreated in a spreadsheet at various flow points, however for this article, the curve is analyzed at 60, 80, 100 and 120 percent of the rated best efficiency flow. Assuming the test conditions to be at 20 degrees C, with the viscosity of distilled water 1.005 cSt and the revolutions per minute (rpm) set at 3,585 for the original curve (see Figures 1 and 2, and Table 1), the spreadsheet can be then customized to correct the pump performance if the pump were to pump castor oil with a viscosity of 300 cSt and a specific gravity of 0.95.
The Hydraulic Institute recommends calculating the parameter (B) based on the water performance best efficiency flow (QBEP-W) as follows:

(Where Vvis is viscosity of the new liquid, HBEP-W is water head at BEP, QBEP is water flow at BEP and N is the rpm of the pump)

Table 1: Calculations developed on pump performance in spreadsheet software
If the parameter B falls within one to 40, then the Hydraulic Institute recommends calculating the correction factors for flow (CQ), head (CH) and efficiency (Cη). You can refer to ANSI/HI9.6.7 – 2010 to understand how these correction factors are calculated and applied to the original water curve.
Furthermore, the increase in power as a result of the fluid viscosity increase can be calculated by:

(Where Qvis is corrected flow at the new viscosity, Hvis-tot is the total head corrected at the new viscosity and ηvis is the new efficiency at the corrected viscosity)
The resulting temperature rise in degree F can be determined from the following equation (see Table 2):


Table 2: Temperature rise in pump
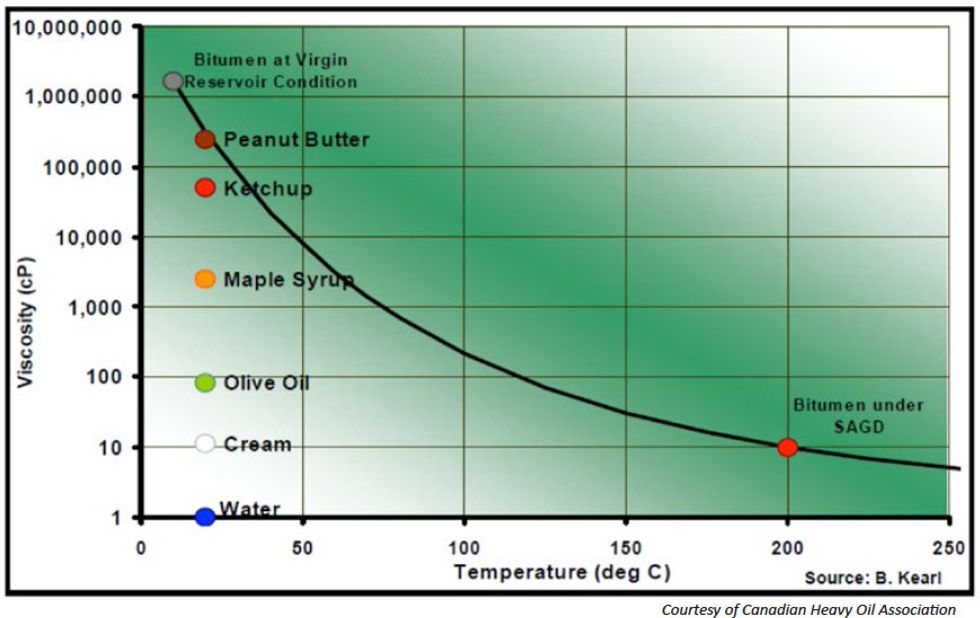
A more practical scenario that you can assess is the effect of an increase in viscosity (see Figure 3) of bitumen (heavy oil) or other process fluids with decreasing temperatures. These cases often arise in operating plants that are situated in northern regions. The failure of electrical heat tracing, loss of process heating and other factors resulting from lower temperatures on pumps located outside the ambient temperature all lead to an increase in the viscosity of the substance being pumped. This, in turn, leads to machinery performance degradation and subsequent failure.

Figure 1: Head, efficiency, power original and corrected curves vs. flow

Figure 2: Temperature rise as a result of drop in pump efficiency
Observations
It can be well appreciated that a rise in the fluid’s viscosity leads to a degradation in pump performance.
- The head produced by the pump decreases
- The brake horsepower requirement increases
- Pump efficiency decreases, which also affects the heat generated (losses) within the pump (Figure 2)
- Changes (reduction) in flow can be observed as a result of change in the H-Q curve.

Figure 3: Graph showing increase in viscosity (cP) as a result of a temperature drop

Figure 4: Viscosity variation on various API grades with temperature
The heat generated in the pump is worth further consideration because it has a direct, detrimental effect on both the operation of the pump and the mechanical seal. It should be noted that the previously calculated Equation 5 (Eq.5, Imperial Units) should not be used to calculate the temperature rise during the shutoff condition. The temperature rise at shutoff is calculated differently from other pump operating points since the temperature at other operating points stabilizes as a result of continuous flow; this is not the case at shutoff. From the aforementioned analysis, it should be noted that the temperature increases with a drop in the efficiency, especially more so as the pump operates toward the left of the BEP point in the low flow region. This can be attributed to a lower volume of liquid carrying away the heat generated as a result of losses within the pump. This is one reason why pumps are equipped with minimum flow lines to avoid excessive heat generation by recirculating flow in the low flow regions.
One key advantage of using equation-based approximate methods to assess equipment performance is the ability to develop simple spreadsheets to simulate performance effects from process changes without spending excessive money on sophisticated and complex modeling software. Basic spreadsheets also have the additional ability to integrate easily with the plant data historian or process simulation software to provide real time data analysis.
These tools provide value to process, project and machinery engineers during equipment selection, rerate and design, in addition to helping the bottom line of an operating plant by helping to troubleshoot operating problems and build on plant reliability.
References
- Hydraulic Institute. Effects of Liquid Viscosity on Rotodynamic (Centrifugal and Vertical) Pump Perfor-mance. Standard ANSI/HI 9.6.7, 2010.
- Karassik, Igor and McGuire, Terry. Centrifugal Pumps, Second Edition. New York City: Springer Publish-ing, 1998. ISBN-9781461566069
- Canadian Heavy Oil Association, www.choa.ab.ca