In this section we will answer these questions.After reading this section you will be able to:
- Recognize which machines should be monitored
- Understand how vibration sensors should be mounted
- Determine how measurement parameters should be set
- Take measurements in a systematic way
Which Machines Need Monitoring?
When deciding which machines to monitor, critical machines should be given priority over other machines. This is much the same as monitoring the health of people. It is inappropriate to closely monitor the health of perfectly healthy people, and then to forsake the monitoring of others who genuinely need it. The same applies when monitoring the condition of machines.
In general, the following critical types of machines should be monitored on a regular basis in order to avoid unexpected and costly problems:
(a) Machines that require expensive, lengthy, or difficult repairs if broken down
(b) Machines that are critical to production or general plant operations
(c) Machines that are known to frequently suffer damage
(d) Machines that are being evaluated for their reliability
(e) Machines that affect human or environmental safety

How Does the Instrument Work?
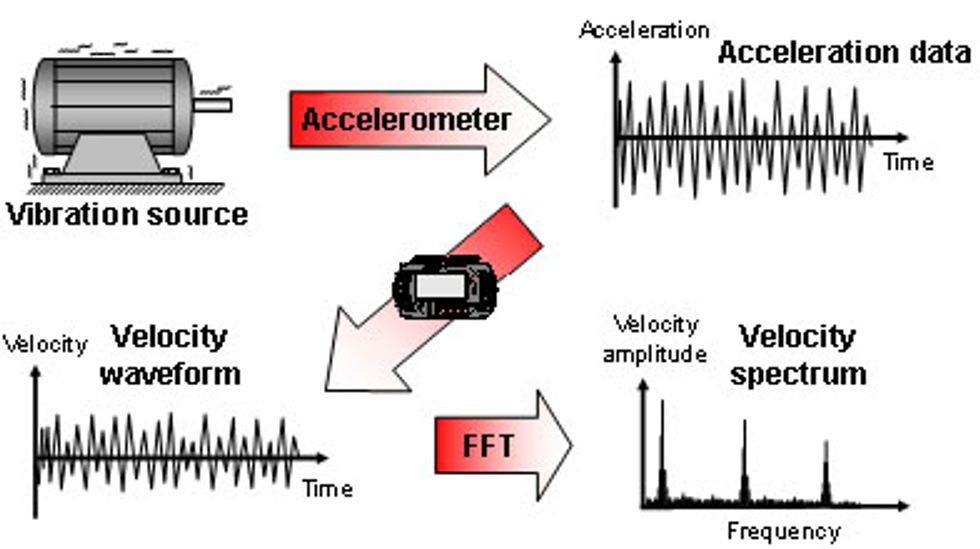
Before taking a vibration measurement, you need to attach a sensor that can detect vibration behavior to the machine that is being measured. Various types of vibration sensors are available, but a type called accelerometer is normally used as it offers advantages over other sensors. An accelerometer is a sensor that produces an electrical signal that is proportional to the acceleration of the vibrating component to which the accelerometer is attached.
What is the acceleration of a vibrating component? It is a measure of how quickly the velocity of the component is changing.
The acceleration signal produced by the accelerometer is passed on to the instrument that in turn converts the signal to a velocity signal. Depending on the user's choice, the signal can be displayed as either a velocity waveform or a velocity spectrum. A velocity spectrum is derived from a velocity waveform by means of a mathematical calculation known as the Fast Fourier Transform or FFT.
The diagram below is a very simplistic explanation of how vibration data is acquired. You may wish to consult other literature such as the vbSeries Instrument Reference Guide for further information.

How is the Accelerometer Mounted?
Most machines involve rotary mechanisms. Motors, pumps, compressors, fans, belt conveyors, gearboxes, all involve rotary mechanisms and are frequently used in machines.
Most rotary mechanisms in turn have bearings that support the weight of rotating parts and bear the forces associated with rotary motion and vibration. In general, large amounts of force are borne by bearings. It is not surprising that bearings are often the place where damage occurs and where symptoms first develop.
Vibration measurements are thus usually taken at the bearings of machines, with accelerometers mounted at or near the bearings.

Since conclusions regarding machine condition - and hence whether or not money and human safety are risked - depend on the accuracy of measurements, we must be very careful how measurements are taken. It is important to always remember that the way in which we mount the accelerometer very much determines the accuracy of measurements.
How should accelerometers be mounted to ensure measurements are accurate and how can we do so safely? Here are some guidelines:
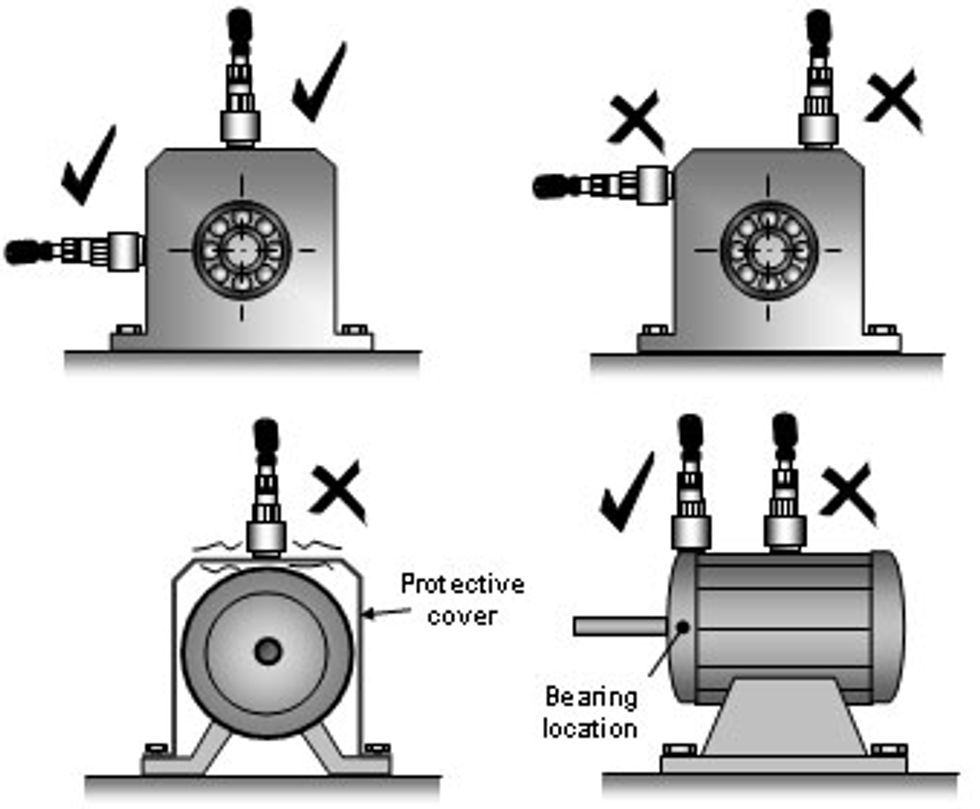
(a) Mount as Close as Possible to the Bearing
Imagine a doctor who listened to your heart through thick clothing and placed the stethoscope closer to your kidney than to your heart. You would likely doubt his diagnosis as he would be basing it on sounds distorted by undue obstruction and noise from other organs.

When measuring vibration we must always attach the accelerometer as close as possible to the bearing. More specifically, we must attach it as close as possible to the centerline of the bearing to avoid picking up distorted signals.

(b) Make Sure the Accelerometer is Firmly Attached
For the accelerometer to detect true vibration behavior, it needs to undergo exactly the same vibratory movement as the vibrating component. An accelerometer must therefore be attached firmly to the vibrating component so that it does not rock or move independently of the component. A loosely mounted accelerometer produces signals distorted by its own independent movements and therefore gives the wrong message.
Various mounting methods exist, but mounting by means of a magnet is the most popular as it offers a balance between measurement reliability and convenience to the user. The magnetic mounting supplied in the Commtest vb kit can be attached very firmly5 , while allowing the user to measure multiple machines using the same accelerometer, with minimum time spent on attaching and detaching the accelerometer.
To ensure that the accelerometer is firmly attached, it must be stuck to a magnetic mounting surface this is even. The magnetic mount must sit securely on the surface with the accelerometer positioned in the prescribed orientation.

For the surface to be even, it must be free of debris, rust, and flaking paint.

The mounting surface must be truly magnetic (iron, nickel, or cobalt alloys). The magnetic mounting must not, for example, be attached to an aluminum surface by virtue of iron beneath the aluminum surface.

To avoid loss of magnetism, the magnetic mounting must not be dropped or heated. Care must also be taken not to strip the screw thread on the accelerometer and magnetic mounting.

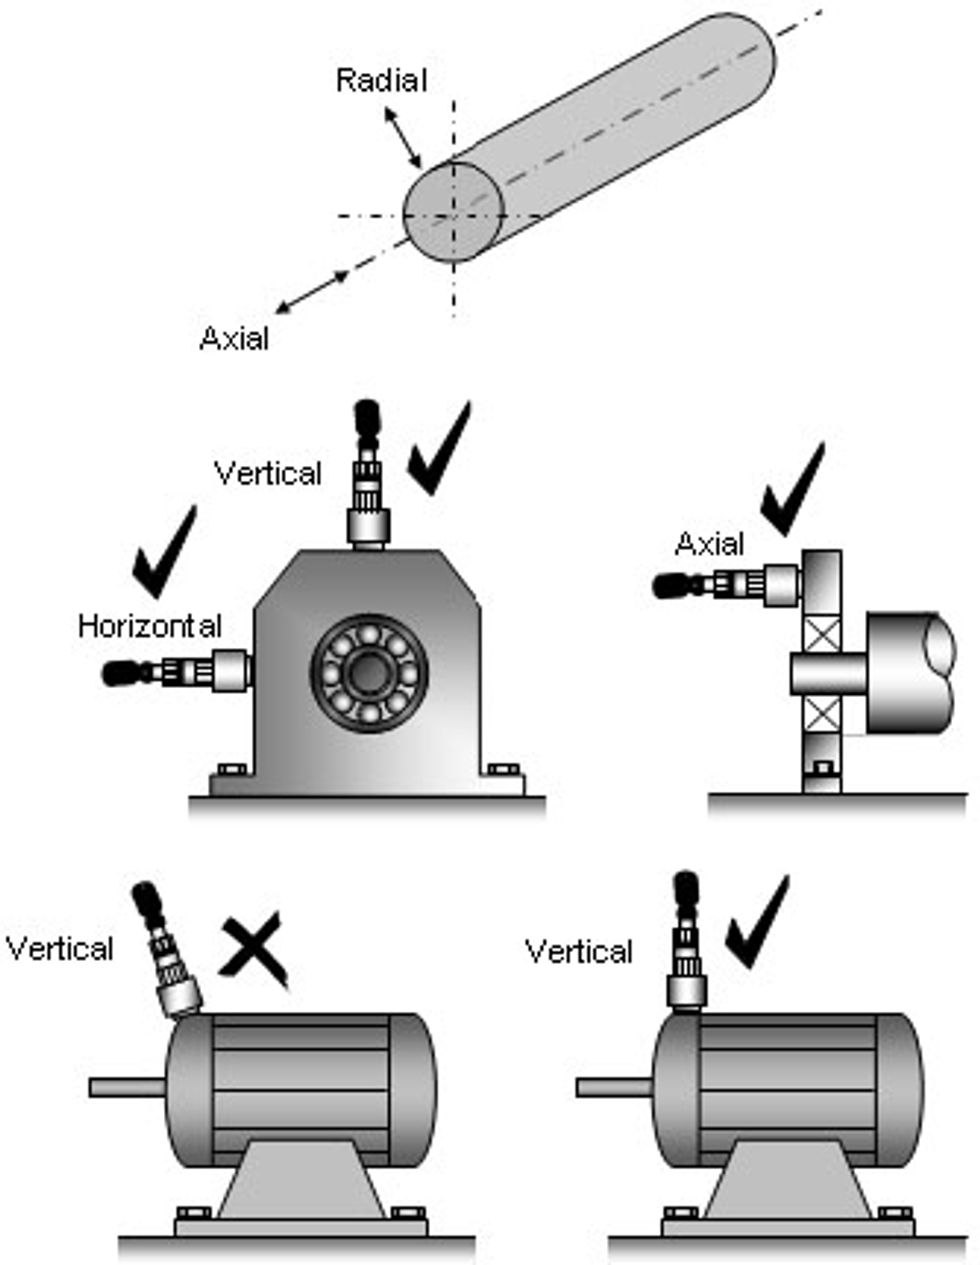
(c) Make Sure the Accelerometer is Oriented Correctly
Different situations require the accelerometer to be oriented differently. For example, to detect parallel misalignment the accelerometer is usually mounted in the radial direction of the bearings, but to detect angular misalignment the accelerometer needs to be mounted in the axial direction.
The signal produced by the accelerometer is dependent on the orientation in which the accelerometer is mounted, since the amplitude (amount) of vibration varies in different directions.

(d) Mount the Same Accelerometer in the Same Location
For a particular measurement point it is important to always mount the accelerometer at the same location to minimize measurement inconsistencies that may lead to wrong conclusions. Where possible, always use the same accelerometer for a particular measurement point.

(e) Mount the Accelerometer on Something Substantial
The accelerometer must never be mounted on a very flexible part of the machine as the spectrum will be distorted by the flapping of the flexible part.
The accelerometer must never be used on structures that are very light as the weight of the accelerometer and magnetic mounting will distort the vibration behavior of the structure. In general, the combined weight of the accelerometer and magnetic mounting should be less than 10% of the weight of the vibrating structure.

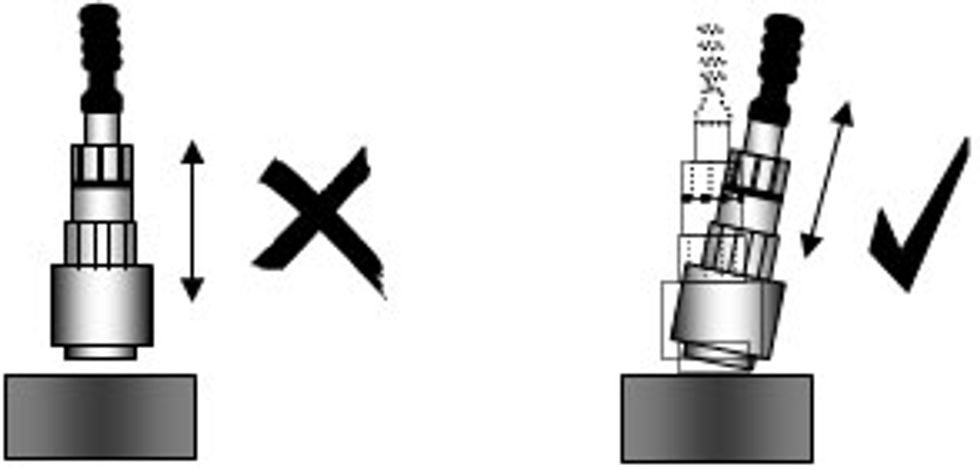
(f) Take Care of the Accelerometer
If the accelerometer is treated roughly it may produce unreliable signals. Because of the strength of the magnetic mount, you must take care when attaching the accelerometer to a mounting surface. You can achieve this by approaching the mounting surface with the magnetic mounting tilted at an angle. When detaching the magnetic mounting, you must not use the accelerometer as a lever for breaking contact. Instead, the magnetic mounting should be gripped tightly and then tilted sideways to break the contact.

The accelerometer cable should never be twisted acutely, but must be anchored in a manner that prevents it from being damaged. Twisted or freely swinging cables can distort the measured spectrum.

(g) Take Care of Personal Safety
You must manage hazards at all times. When taking vibration measurements, three kinds of hazards stand out in likelihood or severity: injury by moving parts, electrical shock, and magnet- induced damage.
Firstly, when mounting the accelerometer, you must take care to prevent the cable from becoming entangled with moving machinery. While the quick-release connector minimizes this danger it should not be relied on as a substitute for correct installation.
Other things that could tangle with moving machinery include loose clothing, long hair, data transfer cables and straps.

Secondly, you must never attach the accelerometer to any high voltage surface as this may cause electrical shock.
Thirdly, you must never bring the magnetic mounting near any magnet-sensitive objects such as pacemakers, credit cards, floppy disks, video tapes, cassette tapes and watches since these items can be damaged by magnetic fields.
There are other possible hazards. You should read and thoroughly understand the vbSeries Instrument Reference Guide before using the instrument or its accompanying accessories.
How are Parameters Set?
What are measurement parameters?
Measurement parameters are the details that specify how a measurement is to be taken. By specifying measurement parameters, we specify how data is to be collected and processed before it is presented to us. Before taking a vibration measurement we need to specify what parameters will be used.
The parameters for vibration measurement may be likened to the 'what and how' details that a doctor must specify before a medical test is performed.

We will now look at how measurement parameters are set when we measure a spectrum. For the rest of this section, we will use the Commtest vb instrument as an example vibration monitoring instrument for our discussions, as it is a particularly simple instrument to use. For example, the default measurement parameter values (except for the default Fmax value) are suitable for taking most vibration measurements, so that in most situations few or none of the default parameter values requires adjusting. These parameters are those displayed in the Set Parameters screen of the vb instrument, with 'domain' set to 'frequency'.
What are some of these measurement parameter values and what do they mean?The parameters used for measuring vibration spectra may be divided into four classes; namely, parameters that determine:
(a) How data is collected
(b) How much or how fast data is collected
(c) How data is processed
(d) How data is displayed
(a) How Data is Collected
The parameters that determine how data is collected are 'Trigger type' and the parameters listed under 'Sensor setup'.
'Trigger type' is the parameter that tells the instrument how to begin measuring. If set to 'Free run', the instrument will take measurements continuously. If set to 'Single', only one measurement cycle will take place. In most cases the instrument can be set to 'Free run'.

The parameters under 'Sensor setup' inform the instrument what type of accelerometer is being used to take measurements. If the ICP®-type accelerometer supplied in the vb kit is used, the 'Drive current' needs to be turned 'ON', and the 'Sensitivity' of the accelerometer needs to match that specified on the vb Quality Assurance Card. 'Settling time' is the time required for the accelerometer and instrument to settle before measurements can be taken accurately. You should use the default 'Settling time' value (which varies with the Fmax value) to ensure measurement accuracy.
(b) How Much or How Fast Data is Collected
The parameters that determine how much or how fast data is collected are the parameters 'Fmax', 'Spectral lines', and 'Overlap percentage'.
In Section 2, we noted that the higher the Fmax, the larger the frequency range over which information6 may be obtained from the spectrum.
Thus, if the Fmax value is high, data is displayed up to high vibration frequencies. To acquire information regarding high vibration frequencies, the measurement frequency - or rate of sampling data - needs to be high as well. As a result, the higher the Fmax, the faster the measurement will be.
The more spectral lines a spectrum has, the more information can be obtained from it. This means that the more spectral lines there are, the more data needs to be collected to generate the additional information, and therefore the longer the measurement will take.

What Fmax Value Should be Used?
The higher the operating speed of the machine, the higher its frequencies of vibration will be, and the higher the Fmax will need to be in order to capture vibration behavior at those high frequencies.

For vibration that does not involve rotary fingers such as gear teeth, fan blades, pump vanes, and bearing elements, an Fmax value equal to 10 times the operating speed is usually sufficient to capture all crucial information.
For example, if the operating speed is 10 000 rpm, then an Fmax value of 100 000 cpm (100 kcpm) is most likely sufficient.
For vibration that does involve fingered elements such as gears, fans, pumps, and roller bearings, an Fmax value equal to 3 times the number of fingers multiplied by the operating speed is usually sufficient to capture all crucial information.
For example, for a gear driven by a 12-toothed pinion rotating at 10 000 rpm, an Fmax value of 360 000 cpm (360 kcpm) is most likely sufficient.
If the Fmax value required is very large the resolution of the spectrum will be low, and information pertaining to low vibration frequencies may be lost. It may be necessary to take some low Fmax measurements in addition to the high Fmax measurement.
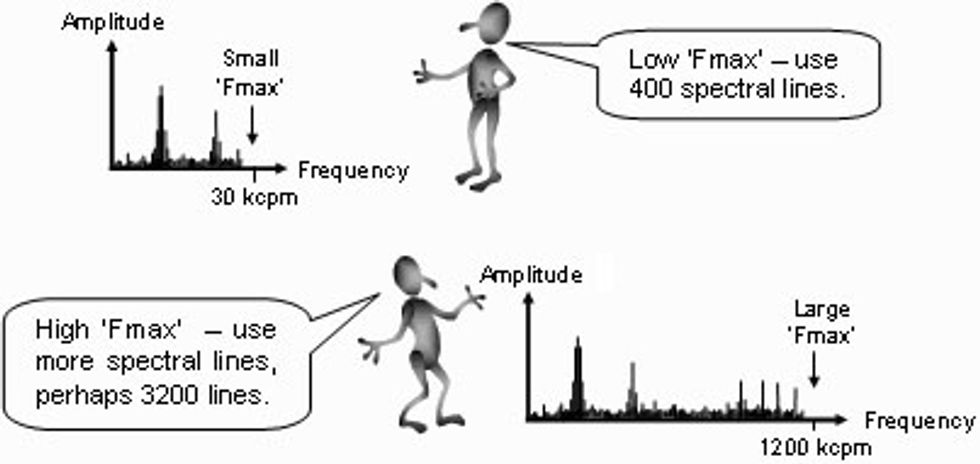
How Many Spectral Lines Should be Used?
In most cases 400 lines of resolution are sufficient. However, if a large Fmax value is used, the lines will be spread out over a large frequency range, leaving wide gaps between lines. Thus, for large Fmax values, more spectral lines may be needed to avoid loss of detail.

It should, however, be noted that the more spectral lines are used the longer the measurement will take and the more instrument memory space will be occupied. A high Fmax value or a high number of spectral lines should therefore be used only where necessary.
How Much Overlap Should I use?
Overlapping data is a means of reusing a percentage of a previously measured waveform to calculate a new spectrum. The higher the 'Overlap percentage', the less newly acquired data is needed to generate a spectrum, and thus the faster the spectrum can be displayed. 50% overlap is ideal for most cases.

(c) How Data is Processed
The parameters that determine how data is processed are the parameters 'Average type', 'Number of averages', and 'Window type'.
Imagine you had to accurately measure the width of the pages in this book. Because the width may vary slightly from page to page, you would probably measure not just the width of one page but rather that of a few pages and then take the average.
Similarly, when vibration is measured several spectra are usually measured and then averaged to produce an average spectrum. The average spectrum better represents vibration behavior as the averaging process minimizes the effect of random variations or noise spikes that are inherent in machine vibration.

The parameter 'Average type' determines how spectra are averaged. 'Linear' averaging is recommended for most cases. 'Exponential' averaging is usually used only if vibration behavior varies significantly over time. 'Peak hold' does not really involve averaging but causes the worst-case (largest) amplitude for each spectral line to be displayed.
The parameter 'Number of averages' determines the number of consecutive spectra used for averaging. The larger the number of spectra used for averaging, the more noise spikes are smoothed out and the more accurately true spectral peaks are represented.
However, the larger the number of averages, the more data needs to be collected, and therefore the longer it takes to obtain the 'average spectrum'. A 'Number of averages' of 4 is sufficient for most cases.

The collected data is usually not directly used to generate a spectrum, but is often modified beforehand to cater for certain limitations of the FFT process (the process that transforms the data into a spectrum). Data is usually modified by multiplication with a correction window. This prevents spectral lines from 'smearing' or 'leaking' into one another.
'Window type' is the parameter that determines the kind of window that is used. The 'Hanning' window is usually used. If the 'rectangular' window is used, the data will effectively not be modified.
 (d) How Data is Displayed
The parameters that determine how the spectrum is to be displayed are listed under 'Display units'.
To specify how the spectrum is to be displayed, the scale of the spectrum needs to be specified. The scale of the spectrum determines how easily spectral details can be seen, and is defined by the parameters 'Amplitude scale', 'vdB reference', 'Log range', and 'Velocity max.
In most cases, the 'Amplitude scale' can be 'Linear'. If a linear amplitude scale is used, then the parameters 'vdB reference' and 'Log range' are of no consequence (and therefore need not be set).
In general, you should set 'Velocity max' to 'Automatic' to allow the instrument to automatically select an ideal amplitude scale that allows spectral peaks to be clearly seen.

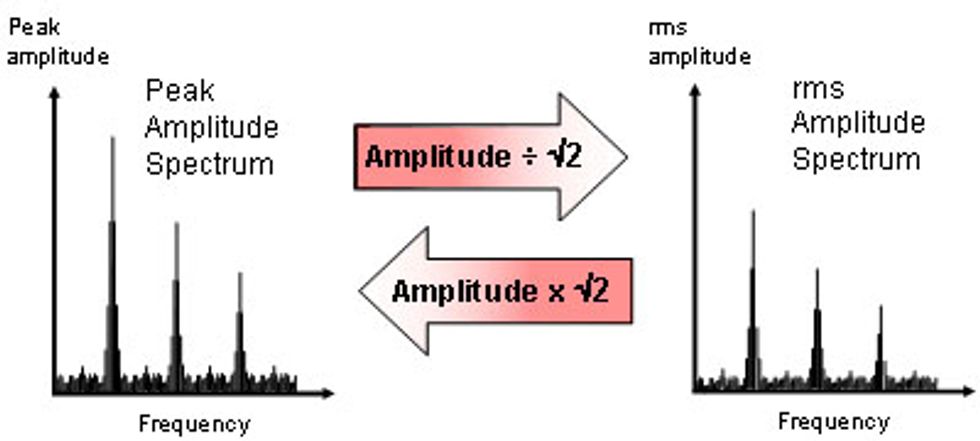
To specify how the spectrum is to be displayed, the 'amplitude type' to be used also needs to be specified. In Section 2 (page 18), we defined two amplitude types - peak amplitude and rms amplitude.
If the 'Ø-peak' (or 'peak') amplitude is used, the spectrum will display the maximum speed achieved by the vibrating component at the various vibration frequencies.
On the other hand, if the 'rms' amplitude is used, a quantity indicative of vibration energy at the various frequencies will be displayed instead.
For vibration spectra, the peak amplitude at a particular frequency is exactly √2 times (roughly 1.4 times) the rms amplitude at that frequency. Thus which amplitude type is used is not really important since amplitude conversions7 may be readily done.

We recommend that you always use the same amplitude type for a particular measurement point to avoid misinterpretations. A switchover from the rms amplitude to the peak amplitude causes an apparent rise in vibration amplitude that might be mistakenly interpreted as machine deterioration. On the other hand, a switchover from the peak amplitude to the rms amplitude might hide a genuine rise in vibration amplitude.
Finally, the amplitude and frequency units to be used in the spectrum also need to be specified. Which units should be used is really a matter of personal choice, or more often, geographic location.
In North America, the velocity unit usually used (for linear velocity scales8) is in/s, and a commonly used frequency unit is kcpm (kilocycles per minute).
In other parts of the world, the velocity unit and frequency unit usually used are mm/s and Hz respectively. Shown below are the relationships between the units9:

5 When pulled perpendicularly away from the mounting surface, the vb accelerometer's magnetic mounting resists with a force of 22 kgf (48.4 lbf)
6 A higher Fmax does not cause more data to be collected but causes the data to span across a wider range of frequencies.
7 For a spectrum, the peak amplitude is times the rms amplitude. This relationship is generally not valid for waveforms.
8 Many vibration analysts prefer the logarithmic velocity unit vdB. However, discussion on logarithmic scales and units is beyond the scope of this book.
9 We have rounded the in/s ø-peak, mm/s rms conversion to 18. The correct ratio is 17.96.
From the Beginner's Guide to Machine Vibration, copyright © Commtest 1999, 2006.
Revised 28/06/06
To find out how to set up your own machine vibration monitoring program, contact Commtest Instruments Ltd or one of our representatives for a demonstration of a vbSeries vibration monitoring system. For the address of your nearest representative please visit our website at http://www.commtest.com


 (d) How Data is Displayed