What is Risk?
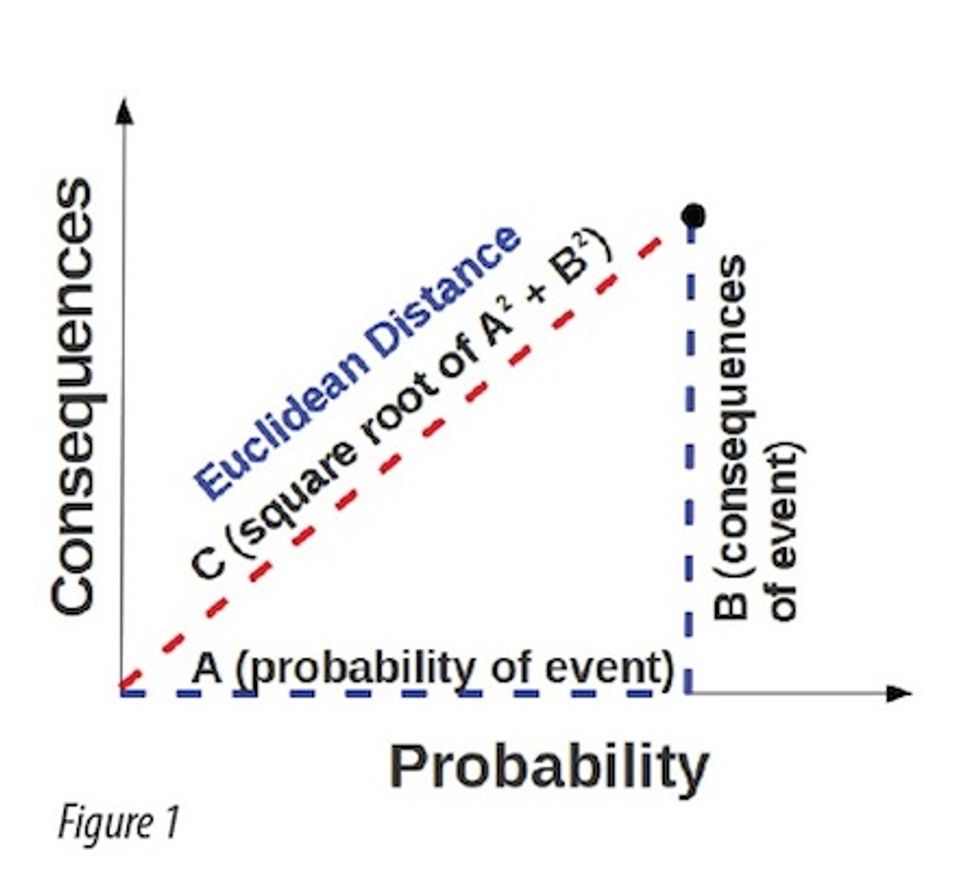
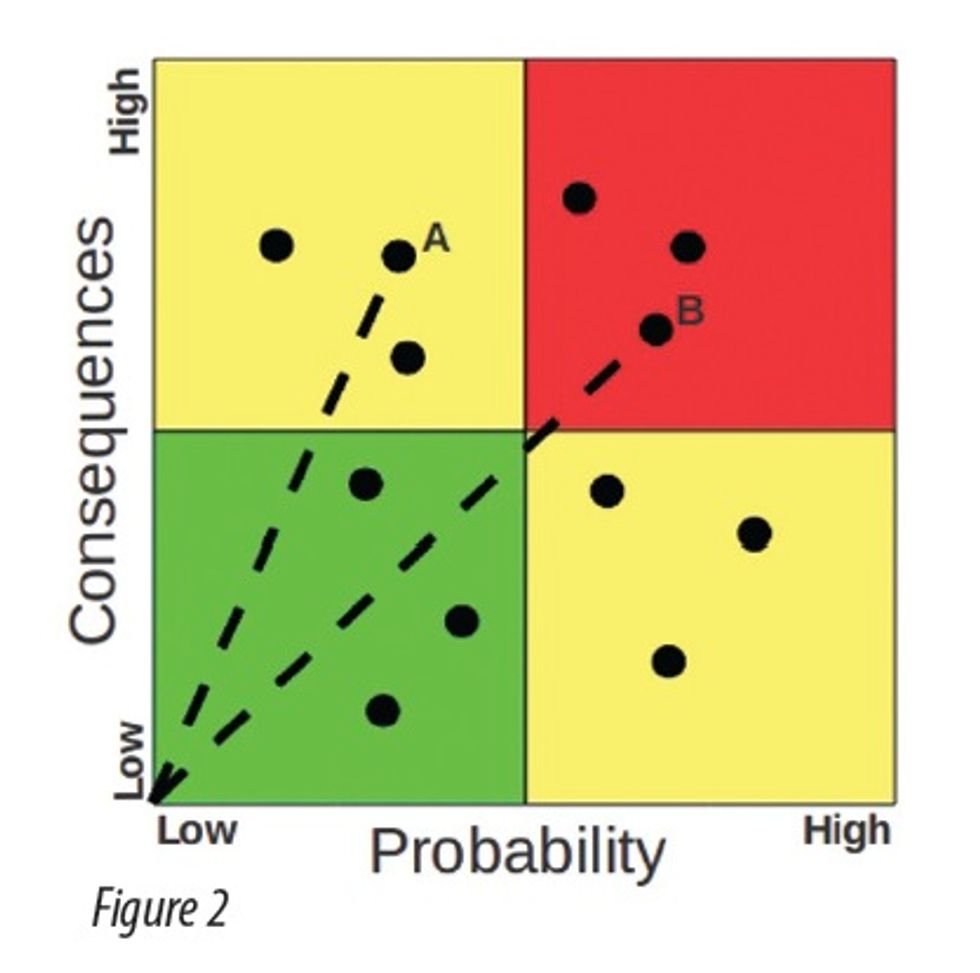
At the most basic level, risk is a combination of consequences and likelihood-of-occurrence associated with an event. Consequences and likelihood are different dimensions, just like spatial dimensions, and should be combined in the same way using a distance-in-space formula (also known as Euclidean distance) using the Pythagorean equation: a2 + b2 = c2. As demonstrated in Figure 1, A represents likelihood-of- occurrence (probability), B represents consequences and C represents combined or overall risk. This provides for accurate comparison of relative risk associated with different events, as displayed using a risk matrix in Figure 2.


Multiple Dimensions of Consequence
Consequences of an event come in many forms. They may include safety and health, environmental, operating costs, and others. The set of consequence dimensions that apply to different organizations or systems vary. Identifying the applicable dimensions is integral to the analysis process. Consequence dimensions are associated directly with the mission and level of service required of the organization or systems, not the events being considered.
A simple sum of ratings from the various dimensions would yield inaccurate results, just as combining consequences and likelihood. So a Euclidean distance formula should be used in calculating overall consequences. The formula is simple even with many dimensions: square the rating for each dimension, add the results, then square root the total.
Good software tools have these calculations built in so the analyst need not be conscious of them during analysis. Figures 3 and 4 (screen-captured images from Criticality AnalyzerTM by Uberlytics, LLC) show how sliders are set for each consequence dimension. The overall consequence value is automatically calculated by the software.


Proportioning Consequence Dimensions
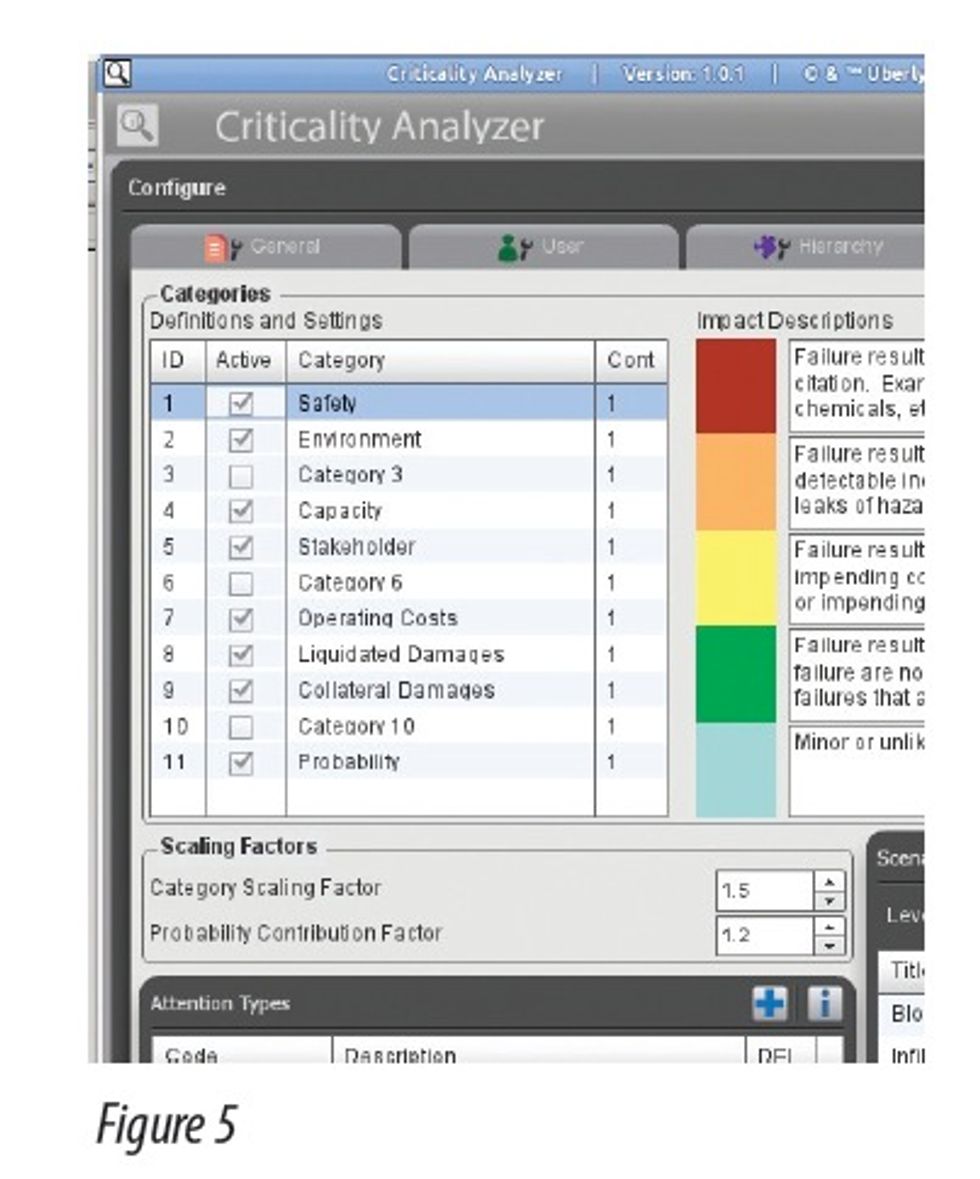
Dimensions may not have equal contributions to overall consequences. Safety and health should normally be given greater weight than costs. Software tools should allow setting contribution proportions for consequence dimensions. Figure 5 shows how Criticality AnalyzerTM provides contribution factor settings for each dimension. Once a tool is configured, calculations should be automatic so that personnel performing the analysis need not track proportions during the analysis.
Care in Managing the Basis of Consequence and Probability
Consider the risks involved when traveling by air, car and motorcycle. Associated event definitions are based primarily on the context and level of service criteria being considered. In one case, the occurrence of any accident may be the event of concern. In another case, only an accident that results in injury or death may be the event of concern. In the first case, a consequence dimension may evaluate potential injury associated with the event. In the second case, consequence dimensions should assume injury or death, not merely accident occurrence. Assumptions by analysis participants can be different in these cases. Likelihood of occurrence is greatly affected by the form of the event. If occurrence of an accident is the basis for consideration, likelihood will be higher than if the event under consideration is an accident that results in injury or death. The latter is a compound likelihood based on the likelihood of both an accident and injury. If evaluating an accident with injury, there is a higher compound likelihood for motorcycles because both likelihood factors are higher than for other modes.
Denominator Considerations
Traveling by commercial air might involve about the same likelihood of being in an accident as traveling by car - if the denominator for likelihood is hours traveled. However, since commercial airplanes travel up to ten times faster than cars, flying may be ten times less likely to result in an accident if miles traveled is the denominator.
Which denominator is correct? If the number of miles traveled is fixed by the context, miles should be the denominator. If travel time is fixed by the context, hours should be the denominator. Experience and care are necessary in order to select the correct applicable denominator and to communicate it to the analysis team.
Consequence Scales
Confusion between outcome of an event and changes in the risk profile associated with the event compromises analysis validity. This is managed by the scales assigned for consequences. The safety and health dimension is often scaled by the extent or significance of injury, such as these examples of scaling values:
- Low = no injury
- Medium-low = minor injury
- Medium = reportable injury
- Medium-high = requires medical attention
- High = permanent injury or death.
However, in most cases, the concern is not specific outcome or results of events, but rather changes in the risk profile caused by the event. For safety and health, any injury is unacceptable, so if even a minor injury is certain to occur, the highest possible consequence rating should apply. Normally, injury is neither assured by the event nor precluded by the event not occurring. A better safety scale might be:
Low = injury occurrence is not affected by the event
Medium-low = injury may occur if event occurrence is not addressed in a timely fashion
Medium = injury may occur if occurrence of the event is not addressed promptly
Medium-high = injury may occur if the event is not immediately detected and addressed
High = injury is likely to occur immediately upon occurrence of the event.
This may be confusing because the scale is almost completely probability based, apparently overlapping with likelihood of the event. However, the likelihood score for an event is based on the likelihood of event occurrence, not a specific outcome of the event.
Risk and Criticality Differences
Risk evaluates events without focusing on the specific systems leading to the event. Criticality evaluates failure of a specific item within a larger system. Risk can be represented by the potential for dying of a heart attack based on overall lifestyle. Criticality can be represented by death from failure of a heart-lung machine. In the risk case, it is an event (heart attack) that is central to the analysis and in the criticality case, it is the heart-lung machine (specific item) that is central to the analysis.
Analyzing risk is important in order to prepare for, mitigate, or reduce the likelihood or impacts of events on a broader scale than the specific item leading to the event. Earthquake risk management does not prevent earthquakes, but allows improvement of response and mitigation of impacts from earthquakes.
Establishing criticality allows attention and resources to be allocated to the reliability and fault detection of critical systems or components. The proper goal is to proactively prevent bridges falling into rivers, not simply get better at emergency responses to bridges collapsing.
Understanding criticality often requires multiple events to be considered and risk evaluation for each item in a system being evaluated. A valve, for example, can stick closed, stick open, stick in mid-position, leak, or rupture. Worst-case conditions define each event; and each may have differing consequences. There may be more than one worst-case event for any single item.
A pumping system rupture may have important environmental ramifications, while the same system failing to pump may impact operational dimensions. This means that criticality analysis is often more complex than risk analysis. Multiple significant events must be risk-evaluated for each item during criticality analysis. Worst-case consequences from the set of events can be then composited into an overall rating for the item.
Criticality AnalyzerTM provides the user with the ability to analyze and composite multiple failure scenarios for each item of a larger system. Figure 6 shows multiple scenarios for a single item, with each scenario having its own consequence ratings.

Figure 7 shows how Criticality AnalyzerTM plots the dimensional consequence scores for each scenario on a radar chart. This allows the analyst to adjust a set of composite sliders to form a best-fit representation of all scenarios to produce overall consequences and likelihood for the item under analysis. These overall values are then combined into an overall consequence score to be plotted with the overall likelihood score on a risk matrix and calculated for an overall criticality rating value for the item.

Conclusion
Risk and criticality are of great value in managing systems and processes, allowing preparation, proactivity and prevention. High profile events, such as the BP oil spill and Japan's nuclear reactor issues, put a spotlight on the need to manage risks. Expectations of system owners and operators are higher than ever and will continue to increase. Diligence, proactivity, prevention and preparation all depend on understanding risk and criticality.

Terry Nelson is a consultant and thought leader in physical asset management. Based in Washougal, Washington, he has decades of experience in nuclear power, water utilities and other industrial processes. He designed and created Criticality AnalyzerTM and currently provides facilitation and training services for users and clients. Terry can be contacted by email at terry@inspiraworks.com. Information about Criticality AnalyzerTM is available by visiting www.uberlytics.com
Read a response to this article written by Brian Y. Webster - Understanding & Comparing Risk