The following case study describes a proven method for detecting failures in the suction or discharge valves inside positive displacement pumps using a unique method of vibration analysis. The determination to find a reliable method of detection led to a greater understanding of equipment and processes, from working with the vendor to implementing a design change. This case study describes a journey from repeated failures to improved equipment reliability and lower maintenance costs.
Note: The following terms and abbreviations are used often in the case study:
Spike Energy = gSE (a high frequency processing technique developed in the late 1970s)
Time Waveform = TWF
Introduction
Yara Belle Plaine is a nitrogen fertilizer plant located in Saskatchewan, Canada, which, for many years, was the largest producing single train nitrogen fertilizer plant in the world. Predictive maintenance (PdM) technologies were employed during the 1992 commissioning of the equipment and are actively used in reliability efforts today. Fortunately, highly skilled and experienced management and employees with PdM backgrounds were available to start up, operate and maintain the new plant.
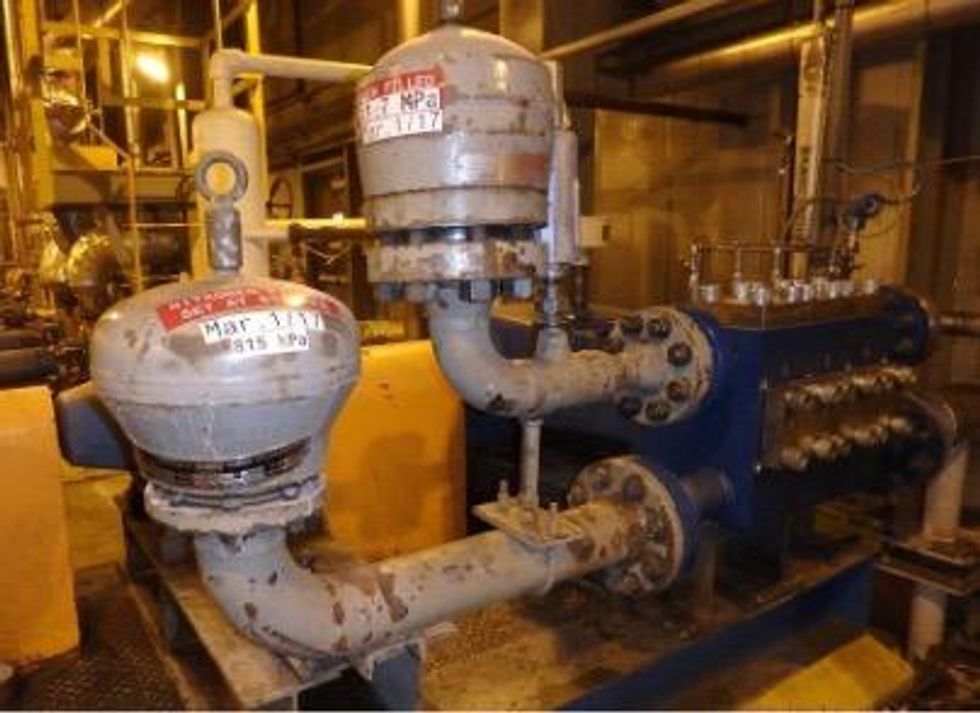
Over time, knowledge and experience with PdM technologies grew exponentially. In the early 1990s, portable vibration monitoring was advancing and industries could see the potential, but there were only a few vendors to choose from. Vibration technology is predominantly used to monitor the typical assortment of rotating equipment found at industrial plants, such as pumps, fans, motors, compressors, turbines, conveyors, gearboxes, and more. This case study focuses on positive displacement pumps like the one shown in Figure 1.

Figure 1: Midsize triplex plunger pump
Case History
Reciprocating positive displacement pumps (Figure 1) operate in many different industries around the world. Reciprocating pumps move fluid using one or more oscillating pistons, plungers, or membranes (diaphragms), while valves in the pump head restrict fluid motion to control the desired fluid direction.
During the suction stroke, the plunger retracts. This decreases the pressure in the chamber, causing the suction valve to open, resulting in the fluid entering the cylinder. In the forward stroke, the pressure in the chamber increases and the plunger pushes the liquid out through the discharge valve and into the discharge pipe at a high velocity and high positive pressure.
The Yara Belle Plaine plant contains a number of triplex plunger pumps of various sizes that operate at very high pressures. The plungers, seals, discharge valves and suction valves all come into contact with the fluid being transferred. Therefore, the material choices are based on the fluid transferred.
Typically, industrial plants use vibration analysis to monitor the condition of the rotating equipment with respect to bearing faults, looseness, alignment, imbalance, plus many other mechanical issues. In this case study, the discussion turns to how vibration analysis was used to determine the condition of the suction and discharge valves in the pump head of triplex positive displacement pumps. Specifically, whether these pump valves were passing.
Why was it useful to know whether one or more of the valves in the pump head were passing? Let’s start by describing the team’s journey to discover whether monitoring the condition of these pump valves was even possible.
Problem
Early on, the valves were failing often in the midsize pumps. Vibration data was collected every two weeks on these pumps, but the valve condition wasn’t found in the vibration data. The team tried collecting overall vibration (velocity); spectral data (velocity and acceleration); overall high frequency envelope data (HFE), namely spike energy/gSE; and time waveforms (acceleration and velocity) in trying to discover some indication that signified the valves were failing. Even the low-tech stethoscope method was tried (and, yes, admittedly, even the screwdriver to the ear).
This went on for a few years and the pump valves continued to fail in the midsize pumps due to premature wear and catastrophic failure. In most cases, the valve disc and seat were becoming wire drawn, which caused a leak path shown in Figure 2.

Figure 2: Failed pump valve from one of the midsize triplex pumps showing wire drawn leak paths, left to right, valve seat with stem, valve disc, spring with retainer nut, bushing that fits over the stem
Spike energy measurement was developed in the late 1970s and has been used in various industries for machinery condition monitoring and fault diagnosis. As compared to other filtered high frequency enveloping methods, spike energy has a unique signal filtering and detection process. In addition to the traditional spike energy overall measurement, the spike energy spectrum and spike energy time waveform were developed and used for vibration analysis. It may be possible to replicate these results with the hFE measurements used in other portable vibration instruments by finding the right combination of settings.
As the team’s understanding of vibration analysis evolved, they learned that the spike energy (gSE) time waveform (TWF) could clearly identify bearing fault frequencies in rotating equipment. The gSE TWF was a rectified waveform in the positive domain, which was ideal for detecting nonsynchronous frequencies in the ultrasonic range.
Confidence using gSE motivated the team to try this measurement on process valve leaks. There were issues in the process plant with regards to isolating a piping system for a hydrotest. The system had a number of isolation valves, but one or more valves were passing, preventing the team from completing the hydrotest. The theory was that if a process valve was slightly open, it should emit high frequencies or possibly ultrasonic frequencies. The smaller the opening that the liquid or air had to pass through, the higher the frequency. Overall gSE was tried because it was a measure of ultrasonic vibration frequency. This turned out to be unsuccessful because there needed to be a baseline measurement to compare with in order to know for sure if the process valve was passing. And, only the gSE TWF could provide the team with the frequencies needed for analysis.
However, that exercise led the team back to the pump valves and the collection of gSE time waveforms was added to the two-week vibration routes on the midsize triplex pumps. The difference between this and the process valves was that by collecting data multiple times, there was baseline data when the valves were in good condition. The next valve failure would allow the team to study the historical data that was collected to find out if this new measurement was going to help.
Before a failure occurred, the team delved into what the pump valves were doing (refer to the parts in Figure 2). There was: sliding motion between the sealing disc and the valve stem along the bushing; spring action; impact when the disc landed on the valve seat; looseness; and liquid flowing through the valve openings. The valve disc traveled from a fully closed position resting on the valve to fully open at some distance away from the valve seat.
The conclusion was that flow induced high frequency vibration should be the greatest when the valve disc was as near the fully closed position as possible, but still allowing fluid to pass by the sealing surfaces. This amounted to a small opening. So, how did the team prove and measure this?
Spike Energy Time Waveform Discovery
Figure 3 shows how an accelerometer with a magnetic base was attached to the trigger nozzle on an air hose in the maintenance shop. With the data collector in live mode measuring overall spike energy (gSE), the nozzle was triggered open and closed. The change in the overall spike energy level was observed. Once this reaction was confirmed, the data collector was set to store the gSE time waveform using various collection filters until the team found the best parameter.

Figure 3: Accelerometer attached to an air nozzle for testing spike energy theory
When the air passed through the air nozzle, the rectified gSE TWF clearly displayed a unique pattern. There were plateaus in the TWF for the time duration of the leak. This was how the team was able to associate a vibration measurement to the pump valve condition. Whether liquid or air was passing through a small opening, the results remained the same – ultrasonic vibration frequency was generated.
Figures 4 and Figure 5 show the gSE TWF collected from the pump head of the midsize pumps. Vibration readings were collected from each pump’s valve location, three suction plus three discharge valves. Figure 4 shows the TWF when the pump valves were in good condition. The narrow spikes in this gSE TWF represent the smallest of openings when each valve is nearest the fully closed position.

Figure 4: Rectified gSE TWF when the pump valves were in good condition
Figure 5 is the time waveform when a valve was passing. It consists of normal ultrasonic emissions from the valves opening and closing, separated by plateaus of high ultrasonic vibration. The time duration of the plateaus was equal to the time elapsed by the plunger stroke in one of the directions (suction or discharge stroke). It was also equivalent to one half revolution of the pump shaft. The difference between the time waveforms was clear.

Figure 5: Rectified gSE TWF when a pump valve was passing
The team’s attention was focused on the midsize pumps before moving on to the smaller and larger plunger pumps. There were more valve failures on the midsize pumps. Now that the team could see the failures occurring, there was a greater understanding of the level of unreliability and the failure modes. This led to discussions with the pump vendor for ways to improve the reliability. The vendor offered the option of installing upgraded designed valves. The new design proved successful and rarely failed.
The team was confident with the results to add this unique vibration measurement to the route readings collected on all the other triplex pumps on site. The valve failures on the other pumps were less frequent, but these failure modes could be seen as they progressed along the P-F curve.
There were many benefits:
- Time to plan the repairs and organize the parts, labor and tools required;
- More accurate records in the computerized maintenance management system (CMMS);
- Operations had less disruption to the process;
- Valve replacement could be combined with other work on the same equipment;
- There was data to support root cause analysis (RCA) and failure mode and effects analysis (FMEA);
- Safety and environmental concerns could be addressed.
Conclusion
In summary, the condition of the valves within positive displacement pumps can be monitored. Learning how vibration technology could be used in this application took years to accomplish, but the rewards were well worth the effort. The team also learned how to think outside the box and use a common PdM technology in a nonstandard application.
The benefits of knowing when pump valve defects have begun can range from economic to safety. Planning and scheduling are improved. There could be RCA and FMEA activities that result in design or operational changes. Production losses and not being able to meet commitments to customers can be avoided. Depending on the level of hazardous product flowing through these pumps, safety and environmental issues may be avoided.
Positive displacement pumps are often high pressure, high flow equipment. The more known about the condition of these pumps, the more they can be operated safely and reliably.