Both the strong competitive environment between companies to secure business and the current world financial crisis are forcing organizations to explore ways to reduce operating costs. A popular approach to reducing operating costs is to reduce expenditures on equipment maintenance. While results can be obtained by reducing investments in equipment, this approach is very shortsighted. It is not unusual for deferred investments to resurface, and then cost two to five times more than if they were addressed in the early stages of failure development.
The case study in this article will objectively demonstrate an approach that focuses on reliability, availability and maintainability prediction. This approach helps detect components, equipment and systems that require improvements. In this case study, these predictions helped maintenance managers make the right decision while analyzing a centrifugal pump system in a gas plant. This process can be applied to many other components and systems across all industries.
Development
The primary function of a NGL recovery gas plant is to recover the rich components of gas (ethane, butane, propane and gasoline) known as “soup”. This soup is dispatched to a fractionating plant, where the components are recovered again and then sold to the market.
The centrifugal pump system analyzed is a critical part of the process, and is basically the core of business. The main purpose of the centrifugal pump is to take the soup out of the main recovery tower, and send the NGL (Natural Gas Liquids) to the dispatching area (see Figure 1).

The pump system is composed of two centrifugal pumps arranged in parallel — one pump is operating and the other pump is in standby. For reliability analysis purposes, the system is called “stand-by redundancy” type 1 of 2, just one pump is in operating mode and the other pump is waiting for failure of the first pump. These are two-stage centrifugal pump type (WTB) and are vertically mounted. They are designed for heavy duty use in refineries, electric centrals and for general services.
The mechanical seal is an important component, due to the possibility of NGL leakage to the atmosphere, which could be dangerous. For this reason, the reliability of the mechanical seal in these types of pumps is a key aspect for the process to maintain the highest levels of both safety and gross margin levels.
Root Cause Failure Analysis (RCFA)
RCFA is a technique that allows us to determine the cause of failure, which could have a physical root or a human root. The purpose of RCFA is to resolve problems that affect plant performance and avoid recurrent problems. There are several techniques used such as FMEA, Failure Tree, Ishikawa, 5 Whys and statistical analysis. In this case study, we have used the 5 Whys technique, Weibull analysis (statistical technique) and examined physical evidence to determine the causes of the centrifugal pump system breakdowns.
Over the last two years, the centrifugal pump system suffered breakdowns due to leakage through the mechanical seal. During the gas plant start-up, we detected quantities of solid particles in the main gas stream, which made the mechanical seals of the NGL pumps fail, taking down the whole system. Most of these solid particles were sand, which, apparently, was a remnant from the plant’s construction, and had remained inside the piping. However, there weren’t solid particles in the main gas stream that could affect the seal face lubrication. Figure 2 shows the physical evidence in the mechanical seal, marks indicating it had run dry (lack of fluid for face lubrication). The 5 Whys analysis concluded that gas operating conditions in the NGL centrifugal pump system had changed; pressure and temperature were unstable, affecting the mechanical seal lubrication. For this reason, a Weibull analysis was performed.

Weibull Analysis
The Weibull analysis is a widely used technique for statistical data analysis. In this particular case, this type of analysis permits us to determine the failure behavior of the mechanical seal (early life, random life or wear-out).
The Weibull distribution is widely used because it has a great variety of shapes, enabling it to fit many kinds of data, especially data relating to product life. The Weibull frequency distribution (or probability density function) has two important parameters: b is called the shape parameter because it defines the shape of this distribution and h is the scale parameter, defining the spread of the distribution. The b parameter represents the failure pattern of the component under study, for instance if b < 1 the piece is failing in the early life, if b = 1 the failure rate is constant and the piece is failing in the section of useful life of the bath curve (see Figure 3) and if b > 1 the piece or component analyzed is failing due to wear-out and a scheduled maintenance is justified.


Where:
R(t): Reliability value
l(t): Failure rate
t: Mission time (hours)
b: Shape parameter
h: Scale parameter (hours)
For this particular analysis of mechanical seal failure, data from mechanical seal failures were collected from the CMMS system to determine the time to failure for every mechanical seal and then computed in a specific software for Weibull analysis (Reliasoft). Table 1 shows the result of Weibull analysis for the mechanical seal of the NGL pumps.

Graphing equations 1 and 2 with Weibull results for running time of 17,520 hours gives us the results shown in Figures 4 and 5.


From the Weibull analysis performed on mechanical seals, pump A is failing in a random way (could be caused due to the variation of process parameters) and pump B is failing on infant mortality zone of the bath curve (could be caused by a combination of variable process conditions, (i.e. pressure, temperature, lack of maintenance procedures and/or a poor mechanical condition of the shaft seal).
Making a comparison between Weibull parameters from the mechanical seal of both pumps against a typical mechanical seal in Oil and Gas industry, it is clear that the life of the mechanical seal analyzed in this article is significantly lower than a typical mechanical seal (Beta=1.4 and Eta=25,000 hours).
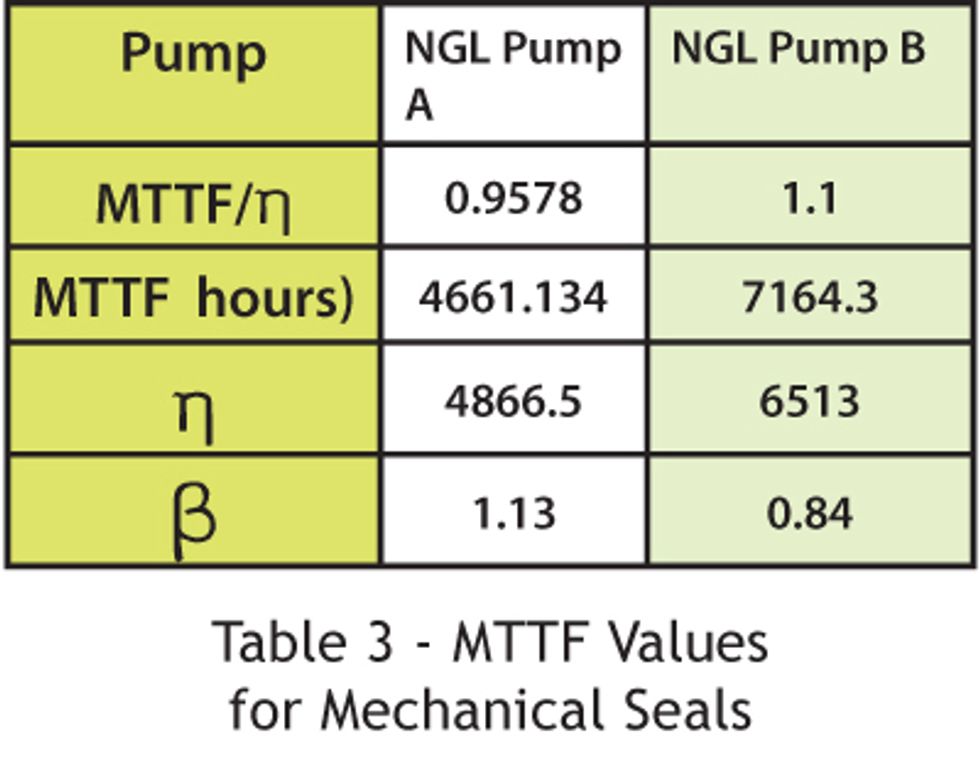
Calculate MTTF (Mean Time To Failure) for mechanical seal with Equations 3 and 4.

Where:
G(1+1/b): Gamma Function
h: Characteristic Life (hours)
b: Weibull Shape parameter
MTTF: Mean Time To Failure (hours)
Use Table 2 to evaluate Gamma function.

See Figure 6 for example calculations for NGL Pump A.


Reliability Analysis for the NGL Pumps System
Because the NGL recovery gas plant would not shut down for the next two years, it was necessary to get the reliability parameters of the NGL centrifugal pump system. Our objective was to know the risk of continuing operation of the pump system under these conditions.
Again, the NGL centrifugal pump units are arranged in parallel mode, being part of a standby system with passive redundancy. More specifically, the system contains a total of k+1 units, and as soon as the operating unit fails, the operator replaces the failed unit with one of the standby units. Figure 7 shows the simple block diagram of the standby system.

For a system with two pumps with two different failure rates, the equation to calculate the reliability value is Equation 5:

Where:
RSB: Reliability Standby system
RSW: Reliability of switch mechanism (100%)
l1 = Global Failure rate operating unit 1
l2 = Global Failure rate operating unit 2
t = Mission time (hours)
Many times, failure rates on some pieces of equipment are not available because they have never failed. Because of this, to establish the global failure rates, the use of an international standards database like API, OREDA or others is required. The failure tree for the NGL centrifugal pump is shown in Figure 8.

Considering all failure modes are statistically independent and a failure of any component breaks down the pump, the global failure rate is the sum of all independent failure rates (see Equation 6). For pump A and B, it is the same procedure, the great difference in the failure rate is the value for the mechanical seal (calculated in Weibull Analysis). In Table 4 the failure rate is shown for both pumps.


Applying equation 5 to calculate the reliability value for the NGL centrifugal pump system at two years for noninterrupted operation (17,520 hours), considering Rsw=1, gives us Figure 9.

Calculating MTTF using equation 3 and the Availability (A) of the Pump System gives us Figure 10.

Where:
lA: Failure rate for Pump A
lB: Failure rate for Pump B
MTTF: Mean Time To Failure (hours)
MTTR: Mean Time To Repair (hours)
A: Availability
Table 5 summarizes the reliability analysis for the NGL pump system.

It is well appreciated that the reliability value for the system at 17,520 hours is too low, leading to a high probability of suffering a failure. However, the availability value remains high (that is typical in the Oil and Gas industry, due to the high redundancy on equipment). The cost of unreliability is the main cause of losing gross margin in most industries, due to a high frequency of failure, wasted time, labor hours and money spent on spare parts. High availability provides the opportunity to make money because the plant is ready to respond. Low reliability provides the opportunity to incur outages, which cost money.
Cost Analysis
Cost analysis is the most important section of any reliability analysis. The main goal of this section is to turn the reliability numbers into money — money that will be used by the Plant Maintenance Manager to justify improvements or to make the right decisions, and thus, avoid losses to the gross margin of the company. Clearly it is the responsibility of engineering departments to define the equipment failure rates and the consequences of engineering practices on the life of the equipment. It is also the responsibility of engineers to convert the results of equipment life and failures into a financial format for clearly communicating within the organization. Equation 7 shows how to calculate the cost of unreliability (COU).

This NGL pump system expects 2.1 failures for the next two years which causes a COU of $590,450 US. The cost of unreliability is divided into these categories:
• Cost of spare parts
• Cost of labor hours per repair
• Cost of lost production
• Cost of mechanical seal failures = $7,000 US (per seal) x 8
(number of mechanical seal failures in both pumps A and
B) = $56,000 US
• Cost per mechanical seal repair: MTTR= 10 hr * 2 technician
* $21 US (cost of labor hour) * 8 (number of mechanical
seal failures) = $3,360 US
• Cost of lost production = 2.1 (number of failures) * 90 NGL
Tons/h * $281 US/Ton * 10 hours = $531,090 US
So, Equation 8 shows that the total cost of unreliability is $590,450 US. The RCFA (The Root Cause Failure Analysis) and Weibull analysis have demonstrated that the mechanical seal of the centrifugal pumps is the main reason of high value of COU.
|
Technical Proposal
With financial figures calculated, the technical proposal to make improvements in the NGL pumps system included:
1. Purchasing one new pump.
2. Replacing the less reliable pump (pump A) with a new one
and sending it to the factory to obtain the original shaft size.
3. Modifying the currently API plan to become independent
of process variables.
Table 6 summarizes the total cost of the technical proposal to improve reliability figures and reduce the COU.

Since the cost of unreliability for the NGL pumps system is $590,450, an investment of $317,000 is clearly well justified to improve reliability figures, and increase the gross margin of the company.
Conclusions
From the failure analysis of mechanical seals, we glean that several factors are causing pumps to break down. One is a process condition variable that makes the seal face run dry. Another cause is the poor mechanical condition (wear) on the pump shaft due to the bad condition of the start-up of the plant (sand in pipes). The Weibull analysis has confirmed the early failures of the seal due to the causes mentioned before. An API plan modification is required to isolate the seal face lubrication from the process condition, and the shaft pump restoration is required as well.
The reliability analysis shows that an improvement in the NGL centrifugal pump system is required. If immediate action is not taken, the gross margin is going to go down year by year. The cost analysis indicates that an investment in this system is well justified to improve the reliability figures.
Tracking the reliability values and keeping the availability indicator in the monthly report is an action requiring implementation as soon as possible. In the Oil and Gas industry, it is very common to find high availability numbers but low reliability figures. For this reason, most companies do not publicize the loss of money due to unreliability (high frequency failures). The cost of unreliability index is a simple and practical reliability tool for converting failure data into cost, helping managers and the entire the organization to understand the problem within a single report.
This article shows the importance of Reliability Engineering and its application to both individual components and to systems. Those companies that start to implement this kind of tool in their facilities will create advantages in increased uptime, decreased maintenance and capital costs, and an increase in the bottom line of the business. In the competitive world of industry, these advantages can make all the difference.
Fernando Vicente is a Maintenance, Reliability and Integrity engineer at ABB Full Service in Neuquén, Loma La Lata, Argentina, and has been there since 2005. He holds a Mechanical Engineering degree (2003) from Universidad Tecnológica Nacional - Regional General Pacheco-Argentina. Fernando also holds a Reliability Engineering post graduate degree (2009). He is a member of the ABB Global Reliability group and has 10 years experience in the areas of supervision and maintenance management of industrial plants.
Fernando can be reached via phone at +540299 4893943 ext. 115 or by e-mail at fernando.vicente@ar.abb.com
Bibliography
1. Eugene A. Avallone, Mark’s Standard Handbook for
Mechanical Engineers, 10th edition. Mc Graw-Hill,
New York, 1996, p.61.
2. Dr. Alessandro Birolini, Reliability Engineering - Theory
and Practice, 3rd ed. Springer, Berlin, Heidelberg
1999.
3. Weibull Database - Barringer & Associates Inc,
http://www.barringer1.com/
4. Dr. David J Smith, Reliability, Maintainability and Risk -
Practical Methods for Engineers, 7th ed. Elseiver
Butterworth-Heinemann, 2005.