When looking at the P-F reliability curve, there are two main categories of maintenance reliability action where resources may be focused: the P-F region and the I-P region.
The P-F region (see Figure 1) is the portion that typically receives most of the attention. Since the equipment defect or failure has already begun, this region is about detecting and predicting equipment failure modes so repairs can be made in a planned manner.

Figure 1: I-P and P-F reliability curve
Basically, you are managing potential failures (P) as they progress toward functional failures (F). Nothing about your activity beyond P will prevent the failures from happening. Even though you may intervene to prolong a condition, the failure is inevitable.
There is certainly a lot of value in the activities in the P-F region. The only way to prevent equipment failure is to do something prior to P. Activity in the P-F region is like checking your blood cholesterol on a regular basis and deciding the right time to take action. Just checking and tracking it does nothing to prevent it. For your equipment, activities in the P-F region include asset condition management efforts, such as vibration analysis, fluid analysis (i.e., wear particle analysis and contamination), infrared thermal imaging, ultrasound testing, operator basic care rounds and a few other reliability elements. In general, the technology and execution of these activities are understood and performed successfully by trained personnel.
The I-P region, as shown in Figure 1, is the time frame from when the equipment was installed to the point in which failure begins. In many evolving reliability cultures, there may be more time spent on the P-F region than the I-P region. But, as organizations mature, emphasis grows in the I-P region.
The I-P region is the only part of the reliability curve where failures actually can be prevented. If any facility is to uncover the hidden plant and improve asset reliability, then a significant amount of resources must concentrate on the I-P region. The short-term financial return is executing strategies in the P-F region, however, the big return area is working in the I-P region. The cost of reliability increases the farther down the P-F curve in which it is implemented. Efforts on the I-P end to prevent failures are relatively cheap compared to those in the P-F area to predict or manage failures.
The I-P region is the only part of the reliability curve where failures actually can be prevented.
The key question in the I-P region is: What can be done to prevent or delay failure? The remainder of this article focuses on the I-P section and what can be done to extend the I-P interval or prevent failure altogether.
There are numerous reliability elements that work to prevent failures. One of them is root cause failure analysis (RCFA). RCFA is both a reactive and proactive action that occurs in the I-P region, but begins in the P-F region. Good RCFA is directly linked to failures by focusing on actual failure modes. With accurate analysis and completion of action items, failures can be prevented for the future, making this a proactive element. Failures not only may be prevented on a specific piece of equipment, but the knowledge gained may be applied to all similar equipment.
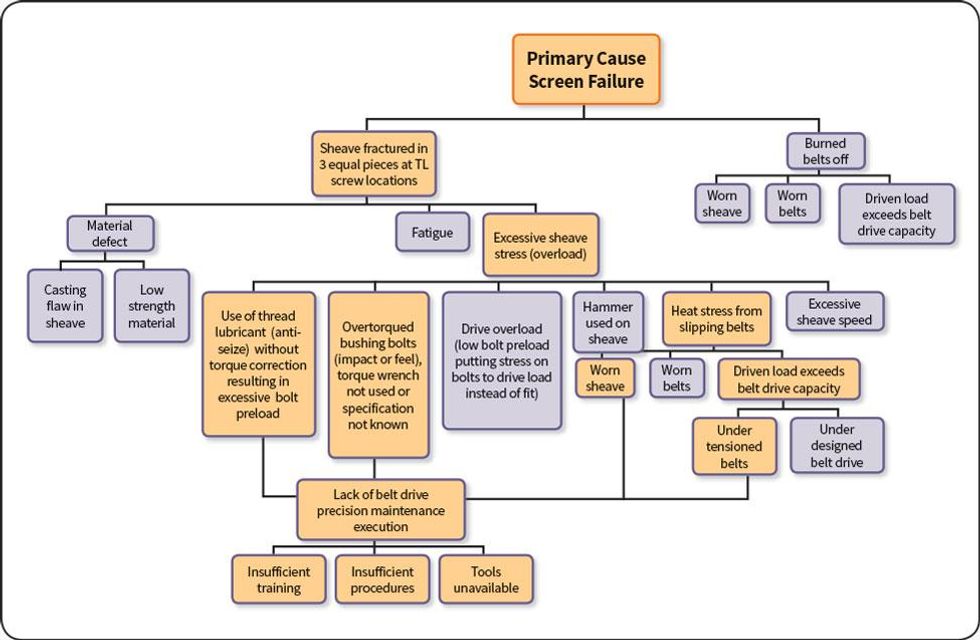
A similar process is failure mode and effects analysis (FMEA). The major difference between FMEA and RCFA is that FMEA is purely proactive, while the latter is reactive initially. FMEA takes a broad look at all possible failure modes, while RCFA looks only at the actual, experienced failure modes. Due to limited resources in many organizations, RCFA is a favorite choice by default. RCFA is very efficient since it places priority only on the items that cause failures. Good RCFA will likely have some action items in many of the other areas discussed in this article. Figure 2 shows a typical logic tree from a failure.

Figure 2: RCFA logic tree
Precision installation is another key area for proactive efforts to improve reliability and prevent failure. Precision installation requires a lot of detail to follow specific component or equipment setup instructions. If components have correct fits, clearances, pressures, alignments, no pipe strain and proper balance quality, the result is longer life. These details only can be established up front at purchase or installation. If you don’t do these things, short I-P intervals will result, or worse, infant mortality soon after start-up.
It’s important to note that infant mortality is defined differently for different equipment, components and failure modes. A bearing that fails in three years may be, in many cases, infant mortality, but a contact lip seal that last three years is considered good life. To be successful in this, good procedures and worksheets need to be in place, as well as properly trained maintenance craftspeople. Only having one of these in place will not yield the desired results. Figure 3 is an example of a bearing fit worksheet to record fits during installation.

Figure 3: Precision practices for bearing fits
An often undervalued preventative failure action is proper spare parts management. This includes having the correct material specifications in a computerized maintenance management system (CMMS) bill of material (BOM) so it can easily be identified and ordered in the future. While a seasoned planner can overcome some BOM errors or gaps, it requires extra work, which is inefficient. This should all be set up prior to machine start-up. The maintenance planner can maintain an already established BOM in the CMMS, but will not have the time after start-up to build an entire system.
Proper storage and handling of spare materials is also important. It has been shown in many areas where failure modes have already begun before installation due to poor storage and handling practices. Is the storeroom set up for good reliability? Does the parts storage area have proper storage conditions (e.g., temperature, humidity, low vibration) and proper storage positions (e.g., vertical or horizontal)?
Another major area that prevents equipment failure is equipment and system design. This can be one of the biggest reasons for unreliability. So, what specific failure modes can be designed out? Proper lubrication systems will ensure the wear failure mode is eliminated or at least reduced to a level that provides very long life. Proper lubrication includes component selection, sizing, seals, contamination control (i.e., proper filtration) and corrosion protection. Design for maintenance is key for ensuring condition monitoring of lubrication systems is done. This includes an oil sight glass, oil sample ports and filtration.
Design also includes proper sizing of components and equipment so they operate without overload or underload conditions. Two examples are a bearing that does not have above minimum loading and a cylindrical bearing used in a thrust application. A process design must fit equipment and components so loading is optimum. Some examples: an oversized process pump that runs near deadhead condition or a bearing that is running under a minimum load. A system design with insufficient net positive suction head (NPSH) for the pump also can cause cavitation related failures. Design also includes fatigue resistance of components, such as proper sizing, metallurgy, strength, surface finish and elimination of stress concentrations. These design conditions result in a chronic reliability issue that only can be solved by redesign. Figure 4 is an example of a process design error.

Figure 4: Design errors showing not enough straight run piping on pump suction
Lubrication excellence means having the right lubricant type and quantity in the right location on the equipment to prevent wear and premature failures. This includes having already established lube routes and a lube database with a trained maintenance workforce to execute it.
Fluid analysis can be an I-P activity or a P-F activity. When fluid analysis reveals the lubricant is degrading, it is proactive (I-P) as it allows for action to occur before equipment failure results. Examples of this include tests for viscosity, water, particle counts, additives, etc. When the fluid analysis reveals wear metals, then lube degradation has already occurred on some level and equipment wear has already begun to show up, as shown in the example in Figure 5.

Figure 5: Fluid analysis failure prevention and management on gearbox
System reliability also comes into play in project management and installation. Having the resources and systems already established enables the operating and maintenance teams to begin proper execution at start-up. This is likely one of the biggest failures in project implementation and roadblocks to reliability. Area maintenance teams do just what their name implies – maintenance. They are not organized to be system builders with all the tasks on their plate every day to keep a facility operating 24/7. If an organization expects a lean maintenance team to build all the reliability systems, then be prepared for frustrated employees and an unreliable operation.
While the activities that prevent failures and extend the I-P interval often don’t get the attention they deserve, these efforts likely produce the best return on investment for companies.
While the activities that prevent failures and extend the I-P interval often don’t get the attention they deserve, these efforts likely produce the best return on investment for companies. Chronic failures that result from design issues are often times very difficult to resolve as they become baked into the physical infrastructure of operating plants. They require extra effort and skills from your maintenance reliability staff to resolve.
The question you need to answer is: Where are the opportunities for your plant to improve reliability on the front end of the I-P region of the reliability curve?