The RCM Scorecard provided prospective RCM project managers, their supervisors, champions and team members with sets of metrics or key performance indicators (KPI’s) they should be aware of that define results from four (4) phases of any RCM effort they are likely to undertake regardless of the RCM approach chosen or the asset to which it is applied. The phases addressed are called “Decision,” “Analysis,” “Implementation” and “Benefits.” The new document, entitled the “RCM Project Manager’s Guide,” uses the RCM Scorecard as a base and also contains:
- readiness factors an organization must ensure are in place prior to committing further on an RCM project
- explanations on pitfalls to avoid
- success factors that work.
All of the above are addressed during the Decision Phase of an effort being considered and influence the outcome of the three phases of an actual project.
Background:
As differing approaches to the methodology we now call RCM began appearing, a major controversy emerged within the Maintenance and Reliability (M & R) community concerning which approach to RCM was “best” in terms of benefits to users and protection against legal liability in the event of major catastrophe involving an asset to which RCM methodology had been applied. This erupted strongly after a series of conference papers and professional magazine articles appeared that touted SAE Standard JA1011 RCM as the only valid, legally defendable approach to RCM.3 The defense was based on good logic and used graphic, world-famous examples such as the Bhopal, India, December 1984, Union Carbide plant disaster, but showed no direct relevance to any given RCM approach used before such incidents per se.
In an effort to quiet the controversy it was proposed initially that a set of metrics could be used to define the results of any RCM effort. Later, the concept of developing an approach to covering all phases of a project was proposed to provide a metrics-based method of evaluating progress and benefits during its various phases. Ultimately, comparison of approaches to RCM became subordinate to simple use of the various metrics to help manage and evaluate results of an RCM project.
The effort to produce the RCM Scorecard was supported by Reliabilityweb.com’s parent company NetExpress.com, Inc. It was facilitated by the author of this paper, by then a former RCM practitioner with over 30 years experience with the various approaches to the methodology who no longer competed for RCM analysis work and had gone on record as a neutral observer pledged to focus on the positive aspects of RCM in all of its forms.
The resulting document is the result of a truly collaborative effort, now available free of charge
A draft RCM Scorecard was made public via ReliabilityWeb.com in January 2005. A workshop was convened in March 2005 to discuss and refine the approach. The workshop was attended by over 100 persons from many different types of organizations from 16 countries. A significant number of leading practitioners of the various approaches to RCM participated as contributors and co-facilitators of breakout sessions addressing the four phases mentioned above. The result of this extensive, one day's effort was a consensus regarding what the content of the RCM Scorecard should be.
The remainder of this sub chapter describes the initial controversy and its resolution in more detail. It also describes what happened after the consensus document was published and how it morphed into becoming the RCM Project Manager’s Guide.
Revisiting the Controversy leading to the RCM Scorecard: Any one having experience with an RCM-based maintenance program after it is implemented can attest to its value and effectiveness compared to earlier approaches to maintenance. However, once more experience is gained in analysis and actual implementation of results on several systems or plants, it becomes apparent that patterns of failures, failure modes and effects are present in many classes of components (pumps, valves, motors, piping, instruments, etc.,) regardless of their operating context, installer or manufacturer. Performing full-blown RCM analysis on a system very similar in design, function and operating context to one already analyzed was also not always possible due to limited finances, personnel assets and time.
Thus, a search began in the early 1980’s for means to obtain close to the same results in similar assets using the refined outputs from those analysis during which all of the seven (7) steps and essential elements of “Classical” RCM had been thoroughly documented.
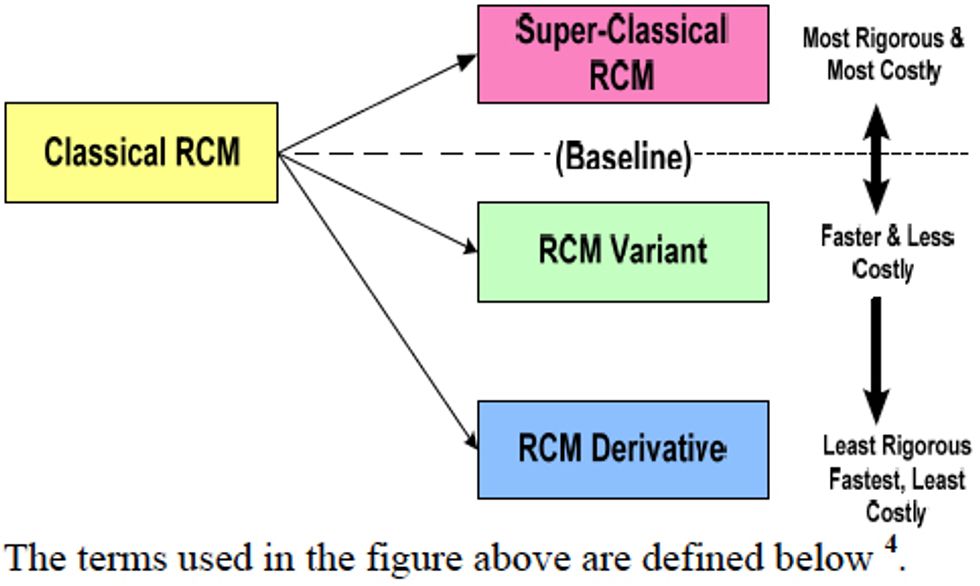
This led to the development of variants and derivatives from the Classical RCM approach and a stratification of RCM methodologies as illustrated in the following figure.

Classical RCM – The analysis approach described in the United Airlines report to DOD in 1978
Super-Classical RCM – an approach that is more rigorous than the Classical RCM methodology
RCM Variant – An RCM approach that skips or combines steps found in Classical RCM or incorporates substitutes for or supplements to Failure Mode and Effects Analysis in order to reduce the time and resources needed for a project.
RCM Derivative – an analysis approach that produces a non-redundant, RCM-like set of tasks (Time Directed Intrusive and Non-intrusive, Condition Directed and, Failure Finding) derived from what is already in the Preventive Maintenance and/or Predictive Maintenance (PdM) Program or within the capability of PdM technologies used.
As RCM variants and derivatives began to appear, the question of what constituted “real” Reliability Centered Maintenance methodology was raised. U.S. military services had by the 1990’s issued standards, instructions and handbooks defining the steps required and the desired RCM process to be followed. However, the key document, the Military Standard, which is where the military services defined “real” RCM, had to be abandoned when the Secretary of Defense in the early 1990’s mandated use of commercial standards wherever feasible. The services and other interested parties began vigorous support for development of an RCM standard that would serve commercial, utility and government purposes.
The result was a proposed standard issued for membership approval in 1999 by the Society of Automotive and Aerospace Engineers (SAE).7 Organizations and individual consulting practitioners offering RCM services that adhered to the SAE RCM standard began touting its merits and criticizing any approach that did not. Participants at professional conferences with any track that included the subject of RCM were exposed to the criticism that anyone offering an “approach” to RCM that is not in complete compliance with the SAE standard wasn’t doing RCM. Adherents to the SAE standard strongly suggested that practitioners of RCM-like analysis techniques drop the term “Reliability Centered Maintenance” and the abbreviation “RCM” from the title and description of their approach and call it something else. Potential clients were advised to avoid RCM variants or derivatives altogether. The fact that many couldn’t afford or embrace (for many reasons) classical RCM or the more rigorous approach prescribed in the SAE standard was largely ignored.
Indeed some suppliers of RCM services developed counter-arguments that implied anyone could afford the approach because of the projected (largely subjectively determined) return on investment that could be expected. Since then there has been a concerted effort by purveyors of all approaches to application of RCM to prove that their approach is better, faster and cheaper, as competition has grown in the field of RCM analysis. Unstated was the reality that companies offering analysis services were rarely involved with implementation and were well away before much implementation and evaluation of the benefits from any given project could be completely proven successful or not.
Basically, the argument between practitioners centered on:
- validity or completeness of results from any analysis approach not in compliance with the SAE standard
- comparison between results from various approaches to Classical or Super-classical RCM
- the liability and possible criminal prosecution exposure of any practitioner that failed to use the most rigorous approach.
Thus, you had not only the “ours is better than theirs” argument but use of a “fear-factor” that was not without merit. However, examples used had no validity in terms of involvement with any more (or less) rigorous RCM approach. There was no direct cause and effect proven by actual history.
Purveyors of some RCM Variant methodologies claim the output from their approach yields virtually the same results as classical RCM methodology. Further, claims are made that such results are obtained at a fraction of the cost of using the classical approach. This claim was based initially on independent analyses using classical RCM and an RCM Variant methodology on a single system of a power generating plant in the early 1990s. The comparison study was sponsored by the Electric Power Research Institute (EPRI), which the funded two analyses (one with a classical approach and one with an RCM Variant approach - Streamlined RCM - developed under EPRI sponsorship). EPRI used this result to convince fossil utilities to adopt the lower cost approach to RCM rather than nothing at all. The supporting contractor, Erin Engineering, now part of SKF Corporation developed their own version of the approach to RCM, SRCMTM.
The controversy reached a peak in late 2002 at the annual conference of the Society for Maintenance and Reliability Professionals (SMRP) in Nashville, Tennessee. There, a paper was presented that showed radically different results from application (facilitated by two different vendors) of two different approaches (Classical and Variant RCM) in nearly identical systems used in the same operating context in two plants owned by the same company.
Unfortunately, all this controversy made understanding and any attempt to cooperate to gain knowledge of the relative value or management of projects employing various approaches to RCM very difficult at the time.
Resolution of the Controversy About Which Is the “Best” Approach to RCM:
In a paper presented at the 2003 SMRP Conference it was suggested that consideration be given by leading practitioners of RCM (users, vendors, trainers, etc.,) to cooperating for the purpose of creating a common set of metrics for use in evaluation of projects, approaches and benefits to clients. 9 It was suggested that metrics may be used prior to, during and after a project to educate, assess progress and determine benefits and/or return on investment. These metrics may also be of value in assessing RCM team performance and in selection of contractors to provide support services and products. If industry members cooperated, it was proposed that a more targeted set of metrics may allow refinement for assessment of projects in progress and for comparison of expected outputs of various RCM and RCM-like (variant and derivative) methodologies.
Challenges were issued at various events, including RCM overview workshops at the 2003 and 2004 SMRP Conferences and during a paper on RCM describing the proposed scope of effort at the first Maintenance and Reliability Technology Summit (MARTS) in March 2004. Work began in earnest later that year to develop the draft metrics-based document.
A number of prominent RCM practitioners accepted the challenge and/or agreed to participate as reviewers and advisors.
NetexpressUSA owner and Reliabilityweb.com publisher, Terrence O’Hanlon, having been cognizant of the controversy and in touch with those at the center of it, decided to sponsor development of a document that would outline an approach to metrics for RCM projects that would be acceptable to a broad spectrum of practitioners and possible clients for projects. He named the project and the document that was to emerge from it “The RCM Scorecard.” He decided to support a series of actions and events that would yield a definitive result, including:
- Development of a draft document, entitled “The Preliminary RCM Scorecard” that would be the basis for discussion and critique by anyone interested
- Publication of the preliminary document on the Internet for downloading and study for a period of over 2 months prior to the RCM Manager’s Forum Conference in Clearwater Beach in March 2005
- Facilitation of communications to the Scorecard content originator and facilitator of comments and recommendations for improvement of the document.
- Sponsorship of a day-long Workshop at the RCM 2005 Conference for the express purpose of having a large number of attendees reviewing and arriving at a consensus on content of the document
- Subsequent publication on the Internet of the resulting “consensus” document for general reference by noncommercial users without permission and by commercial purveyors of services with permission.
NetexpressUSA followed through on all of the above items.
Based on recommendations from the many participants in its development, the RCM Scorecard was expanded from its original five (5) tables (those first developed by Mac Smith for metrics for the analysis phase of projects) to eleven (11) tables of metrics, measures or KPI’s. Definitions of terms used in the document were added for better understanding. In addition, descriptive notes were added at the beginning of the document to provide for consistent interpretation of the numbers that could be derived. A 12th table was added at the end to indicate what constituted desirable directions of trends in metrics included in the benefits tables of the document. An overview of the contents of the RCM Scorecard follows below.
RCM Scorecard Overview
The RCM Scorecard contains four sets of metrics tables. The individual metrics contained in the tables are defined in a five (5) page glossary at the end of the 22 page document. The groups of tables are categorized as follows:
- Baseline and Decision Metrics used before any project begins to decide whether or not to conduct RCM (2 tables – 33 items to select 10 or 12 from) Then from the 33 metrics a few (6 to 8 of about 22) may be used later as a basis for comparison of before and after project performance.
- Metrics used to determine progress and/or results during the main phases of an RCM project (given the decision to proceed), divided as follows:
- Analysis phase (5 tables – 31 items to select from)
- Implementation phase (2 tables – 12 items to select from)
- Benefits phase ( 2 tables – 22 items to select from).
Relationships between the sets are illustrated in the following flow chart.

The first thing anyone considering RCM should do when using the RCM Scorecard is to focus the “Baseline and Decision Metrics” Section. This part may be used to justify quantitatively the use of RCM to improve maintenance and reliability performance. The idea is that metrics should be used to decide whether or not to conduct an RCM analysis, although for some organizations, a non-quantitative decision may be sufficient to proceed (as indicated in the Case Study entitled “RCM at Fossil powered Electricity Generating Plant, which follows in this sub chapter. Given a decision to proceed with RCM, “baseline” measures of what has been achieved before implementation of an RCM Program should also be preserved for comparison with what is accomplished (during and) after implementation. Such comparisons will demonstrate the benefits derived from the changes accomplished as a result of RCM projects.
In the figure below the time relationships between phases of and RCM project are shown. Latter phases over lap.

If a decision is taken not to apply RCM, then the usefulness of the remainder of the Scorecard, except for the Glossary is probably zero. When a decision is taken to proceed with an RCM project, progress during analysis and implementation can be determined using the metrics discussed below for these phases.
Obviously, analysis cannot begin until a decision is made to start an RCM Project. However, implementation can start very quickly after analysis begins. In many cases, benefits can be recognized almost immediately after action is taken to implement an action item. Thus, both implementation and benefits phases can and should be illustrated as overlapping the analysis phase. Many mangers who sponsor or become champions of RCM fail to recognize this and hold off implementation until analysis is complete. Those engaged in analysis, however, recognize many “ah-ha” moments as they discover things that they know would have immediate impact if actions were taken. Benefits may accrue well after implementation as the effects of changes to a maintenance program begin to take effect or accumulate together to improve reliability, productivity and output.
Current or “Old” Maintenance & Reliability Program Baseline Metrics
Table 1, lists a number of metrics, measures or KPI’s that may be used to justify application of RCM to an asset. Explanation of how these are used for justification follows the notes.
Table 1- Current or “Old” Maintenance and Reliability Program Baseline Metrics

Notes applicable to Table 1:
Note 1: Where a metric involves labor hours, it may be useful to break out subsets by trade category (e.g., Electrical, Mechanical, etc., )
Note 2: It has been useful in some instances to distinguish between labor hours and replacement parts cost for repair of the primary asset to be subjected to RCM analysis and conversion to a new program and labor hours and replacement parts cost for or collateral damage in secondary assets beyond the primary.
Direct measures related to the type of tasks employed in maintenance have been found to characterize the most successful organizations. KPI’s related to tasks may also be useful in reaching a decision on whether or not to engage in RCM analysis for an asset. In addition, if the decision is taken to conduct an RCM analysis, task metrics may be used for comparison of the pre and post RCM maintenance programs. In general, the following statements apply to types of tasks employed in RCM Based and Pre-RCM programs:
- Non-intrusive maintenance tasks are preferred because there is less likelihood of functional failure after conducting them, caused by human error, than there is for intrusive tasks.
- The more non-intrusive maintenance tasks, relative to intrusive tasks, the more effective a program is in avoiding unscheduled downtime and lost production. RCM analysis, if properly focused and led can move an organization in the direction of non-intrusive maintenance.
- The greater the percentage of on condition or condition directed tasks, the lower the overall cost of maintenance due to the fact that no actions other than monitoring are performed until condition directs a repair. With adequate knowledge of Predictive Maintenance and/or Condition Monitoring technologies, an RCM analysis team can move a program in the direction of condition directed tasking and philosophy
Other points about maintenance tasks reflected and associated metrics are as follows:
- The effectiveness of a Predictive Maintenance (PdM) program can be measured in part by determining the percentage of PdM tasks that have been able to identify onset of functional failure in some definitive period of time (such as a year).