Here are twelve steps, some simple and others less so, that will help improve the results you are getting from this remarkable technology.
1. Safety
Clearly the first step in any successful thermography inspection is to ensure all work is done as safely as possible. While most are familiar with NFPA 70E, we find there are still gaps in both a practical understanding of the document as well as, importantly, the implementation of the guidance it provides.
Among other things, NFPA70E (as well as common sense) suggest thermographers should:
• be working with written work procedures
• be qualified to do the work
• follow the guidance in the new version relating specifically
to thermography
• have conducted an arc-flash analysis and kept it updated
• wherever possible, reduce risk by improving the system fault
protection and coordination
• wear appropriate personal protective equipment
(PPE) and observe required working distances

Realistically, there may be some equipment that cannot be inspected live. The appropriate use of IR windows and viewports should be considered in many instances as a means of improving inspection access and frequency. These devices should not be used, however, without careful planning and forethought. The safety goal is always ZERO accidents and injuries!
2. Master Your Imaging System
Too often we find otherwise intelligent people using their infrared imaging systems as if they are “answer machines!” They are not! They are tools which, when properly used, will give remarkable data for our interpretation. Simply relying on “auto adjust” or “temperature alarm” functions is not only insufficient, it is dangerous because it means you will miss problems, probably serious ones. A qualified thermographer knows how to use the infrared imaging systems fully—focus, adjust the image manually, capture data with care, use measurement tools appropriately, correct for emissivity, background and transmission, etc—and, importantly, also understands the limitations of the system and technology. If you don’t know how to use a tool properly and fully, you will not obtain consistent, high-quality results.
3. Open, Inspect and Close
In the past, thermographers often simply opened a number of enclosures and then came back and “inspected” them. This proved not only unsafe, but also a bad practice as it allowed for significant cooling of the enclosure’s interior prior to inspection. Best practices now suggest a preliminary look at the enclosures prior to opening any of them; if one is abnormally warm, additional precautions may be warranted to gain access. Additionally, it may be useful to correlate the thermal signature with airborne ultrasound detection.
Please note, there are still some who insist, for various reasons, that they can fully inspect electrical equipment without opening the enclosures. These cameras aren’t x-ray machines, they measure surface temperature only. The notion of being able to “surface scan” is not true, regardless of the type of imaging system or the skill of the thermographer! At best, there may be some indication of internal heating; at worse, there will not be a detectable signature. Gaining safe access to the enclosure is essential, either by opening it while it is under load, de-energizing it and then opening it and inspecting immediately thereafter, or by use of IR windows or viewports (discussed below).
At that point, as is appropriate, enclosures can be opened—again best practices suggests this be done not by the thermographer but by a qualified assistant who can also act as a safety backup and take load readings, and who understand the local system if their thermographer does not.
The inspection should be conducted systematically, using imager settings sufficient to detect any abnormal temperature increases. While the inspection can be conducted quite rapidly, thoroughness should not be sacrificed in the interest of speed.
Many components will have bare metal (low-emissivity) surfaces that can make detection of problems, as well as the measurement of their true temperature, difficult or impossible. Recognize that some may appear normally warm (contactors, overloads) or cool (surge protection). Similarly, some equipment may not be in operation or under full load at the time and this should be noted for later follow-up.
All abnormalities should be noted for later prioritization. Best practices generally suggest documentation only of anomalies but, when access is challenging for any reason, full documentation may be warranted to facilitate possible later analysis. Doing so also assists in trending of anomalies where applicable. Documentation should include thermal images, preferably with two or three of the phases for comparison, as well as a comparable visual image and, as needed, voice or written annotation. Any anomalies judged to be of an emergency nature should be dealt with immediately.
4. Where Appropriate, Consider Using IR Windows or Viewports
More and more often, safety concerns suggest we should minimize the opening of electrical enclosures while they are under load, and yet, not doing so can severely limit our ability to get good data.
One solution that is now being widely used is the installation of IR-transmissive windows or view ports. These devices enable a trained thermographer to look inside the enclosure without opening it. NFPA 70E allows theses devices to be considered as “barriers” thus potentially reducing the level of PPE and the approach distances used.
The use of such devices, however, is not as simple as may be assumed. Care must be given to proper sighting of the device in the enclosure to optimize viewing and to using the device effectively and safely. Because IR windows attenuate the thermal signal, both simple detection of an anomaly as well as measurement of the temperatures involved can be problematic. While a full discussion is beyond the scope of this article, it should be noted that without a carefully developed written procedure for using IR windows and viewports, results can be poor or misleading. Enough of these devices have now been installed, however, that good precedents can be established to ensure good results.

5. What Is The Load?
Basic electrical relationships, I2R=P, clearly tell us heat output (P) increases at the square of the load (I). Heat output will increase exponentially as the load increases. The relationship being between the square of the current and heat, when you double the current, you increase the heat output 4 times. Increase load by 3 times, heat output increases by 9 times. Since heat is the “enemy” thermographers must, therefore, be particularly careful when inspecting equipment while it is under a light load where those loads will increase at some point in the future. The NFPA-70B recommendation for loading is 40% as a minimum, unless loads are normally below that level and not expected to increase.
Likewise, and much less well recognized, is the relationship between the temperature of a material and its electrical resistance. Some will scoff at this notion, and in rebuttal, I would like to offer an experiment to prove this out. If you have access to a low-resistance ohm meter, measure the resistance in a sample of copper bus at room temperature. Then, cold soak the sample in a freezer for 8 hours or so and repeat your measurement. Then, for good measure (pun intended) heat the sample (safely!) to 200°F and measure again. You’ll be surprised at what you find. The vicious cycle of increased loads and heating resulting in increased resistance and more heating is one of the reasons anomalies can remain relatively stable for long periods of time before coming rapidly to a point of failure. The near impossibility of predicting exactly when that failure will actually occur has caused many good thermographers a sleepless night or two and should never be underestimated.
Some suggest that the different loads a thermographer invariably encounters can all, somehow, be miraculously “referenced” back to a 50% norm. While this may be possible in a specific instance with considerable engineering modeling, to think that it can be done wholesale is a mistake no reasonable person should make. Only two things are certain about inspections performed when loads are light and will increase: (1) some anomalies may go undetected and (2) those that are detected may be underestimated because they will generally appear cooler than when loads increase.

6. What Is The Thermal Gradient?
We are limited, for the most part, to seeing radiation coming from a surface. As the surface warms it gives off more radiation that can provide an alarm of a change. The driver of that changing temperature, however, is almost always internal to the surface we see; that is, the point of electrical contact and high resistance heating.
While it is important to view components as directly as possible, for some, such as a bus stab for a fuse block or a transformer bushing, this may be difficult or impossible. Even when viewing components directly, respect that there can be a significant “thermal gradient” between the surface being viewed and the internal source of heating. This can be seen, for example, when a bolted connection becomes welded together at the threads or when a plate connector shows pitting on the contact surfaces. For very large gradients, like an internal fault on a transformer bushing, the indication of a severely degraded problem may be only a few degrees rise in temperature over normal.
If conditions are poor for an inspection, a lightly loaded system or wind, for example, a relatively insignificant indication exhibited by a large gradient component may go undetected. To better understand the significance of findings, it may be useful to categorize gradients as either small (connectors viewed directly), moderate (breakers or large connectors) or large (oil-filled devices and bus ducts).

7. Bare Metals Are Difficult to Understand
One of the most poorly understood issues thermographers must contend with is the low emissivity (and high reflectivity) of bare metals. The result of this inherent physical property is that bare metals not only don’t reveal their true temperature easily but they also tend to mask over it with untruths!
While it is possible to make corrections for emissivity, the reality is that errors are unacceptably high when doing so for any bare metal. In many cases, the real danger is not just an inaccurate measurement, but a failure to detect the anomaly because the mix of emitted and reflected radiation is so confusing. As a practical guide, and many will find this shocking, it is virtually impossible to accurately and repeatably measure the temperature of a bare metal surface that is as “bright” as any of the coins in your pocket. This is true regardless of your procedure or the brand of infrared system you are using. It is also nearly as difficult to measure phase to phase differences when they are bare metals.
In the end, it is always advisable to increase the emissivity of bare metal surfaces using an appropriate high-emissivity “target” material such as electrical tape or Glyptol paint. If this is not possible, look for a nearby high-emissivity surface, such as the conductor’s insulation or a cavity radiator, make your measurement there and acknowledge the probably large size of the resulting thermal gradient.
8. What to Inspect and When?
It is vital to structure inspection routes to optimize the reliability of essential equipment. The process begins by defining what is essential, a task that has often already been done by someone in an organization. While the “high” end of a system (switchgear and transformers, for example) is typically considered vital, downstream equipment must also be considered carefully. The HVAC system for the electrical room, for example, is often critical for reliable operation, and the loss of something as seemingly insignificant as a fuse in a control system can have dire consequences. Routes are best designed with input from all relevant stakeholders.
The task of assigning a frequency of inspection is one that is all too often either over simplified (“annually”) or made far too complex. Initially the driver for frequency will be based on the resources available for inspection. Those should be distributed in such a way as to provide the greatest returns on the investment after considering such factors as the age of the equipment, its duty cycle, whether or not it is housed in a cooled area, the history of failures, etc.
After several inspection cycles, the feedback provided by the inspection results will serve to help refine the frequency. If for no other reason (and there are many others) it is crucial to note all anomalies, even if they are not all immediately repaired. Anything less than that will only result in a misplacement of resources.

9. Note Everything That is Abnormal, No Matter the Temperature
Too many thermographers make an arbitrary decision to only note “hot ones.” This is a mistake for several reasons. First, the only way to accurately gauge asset health is to document everything. Of course, it is not realistic to think that every finding will be addressed immediately but there must be room in the maintenance system to at least note all abnormalities and deal with them appropriately.
Second, serious problems may not appear particularly warm at the time of the inspection for any number of reasons. For instance, if the load is light, not much heat will be generated but, of course, loading can quickly change. As stated before, equipment with a large gradient will rarely show up as very warm and some equipment, such as surge protection, is near failure when it exhibits even a small rise in temperature over normal. So note everything that is not normal and then figure out how much of a problem it is and what to do about it.
10. Measure Temperatures, But Do It Well
While it is often challenging to make accurate measurements of electrical components, every effort should be made to do so while also understanding the degree of confidence inherent to a particular measurement. In fact, it is useful to look at not only the component temperature (corrected for emissivity and background if possible), but also the rise over ambient air temperature and the phase-to-phase rise as well. These latter two will help one understand future changes in temperature that may occur and to isolate a rise related to failure.

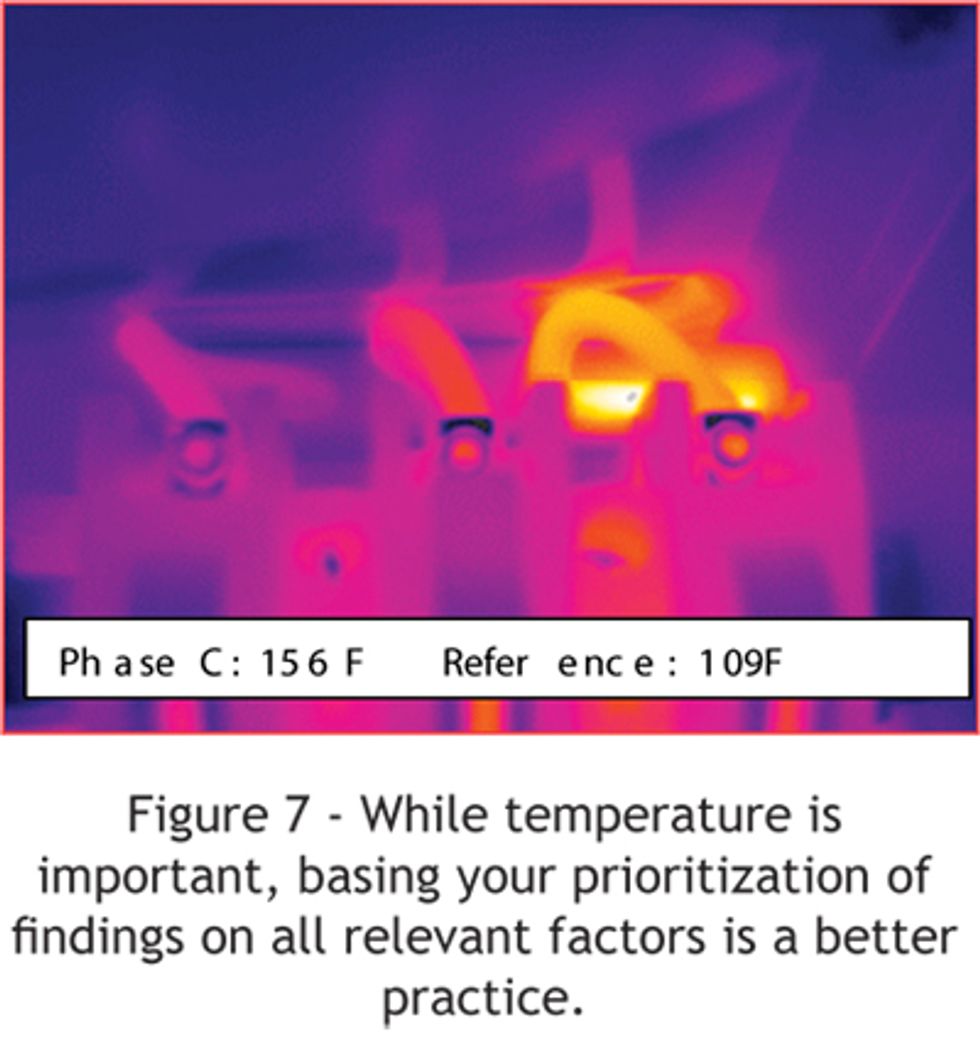
11. Prioritize Findings Based On All Relevant Factors, Not Just Temperature
Logic suggests that the hotter an abnormal component, the closer it is to failure, and this is often true. However, it is not always true AND there are many instances where we don’t have a good indication of either how hot it actually is (or could become), or how eminent that failure is relative to the heat we see. Best practices suggest prioritization of findings be based on all relevant factors, including temperature, but also including the reliability of the data, the criticality of the equipment, the potential for injury, etc. Trending can be performed, but only conservatively and with great care, and with an understanding of the thermal dynamics involved.
Far better to dump all findings into one of three “buckets”:
(1) those close to failure or for which the risk is too great
(2) those which can be monitored and managed until appropriate repairs can be made
(3) those which are in good health
This simple, flexible approach yields remarkable results without being paralyzed by a complicated analysis. A methodology can also be developed and used to provide ever increasingly “smart” results as the system feeds back into itself.

12. Re-inspect After Repairs
In many companies, and for many different reasons, 50% of repairs are not effective the first time. Therefore, it is crucial to re-inspect after repairs have been made. The feedback will help drive improved quality, both on the inspection side as well as the craft side. The payoff for re-qualifying work is immense and should not be ignored or short changed.

Summary
There may well be other steps to success or variations of the twelve we’ve discussed. The bottom line is infrared is a remarkable tool that will provide returns far in excess of nearly any other maintenance investment possible, but it is not magic! To ensure a full return on the investment, thermography must be used intelligently by qualified people.
An infrared imaging system is one of the most powerful tools available to anyone involved in maintaining or testing electrical system. If, however, it is not used properly, this remarkable technology can actually be a dangerous diversion from or mask over what is reality. Modern infrared systems are very reliable and very easy to use; the limiting factor is typically the human being using the infrared system. Qualification is essential to both understanding any problems that are found as well as not missing problems that are there but not obvious. Qualification of thermographers is based on training/education, qualifying experience and proof of qualification (testing). Without that, chances are good there will be quality problems and consequences.
John Snell has been a leader in the thermographic profession for more than 25 years. He established Snell Infrared to serve the needs of the thermographic community. Snell Infrared has constantly expanded their training services and developed extensive on-site offerings for leading companies throughout the world. John continues to be professionally active in his capacity as President of the Snell Group. He was on the Steering Committee for the Thermosense conference from 1990 to 2004 and was Chair of Thermosense XVI and XX. He has worked on the standards development committee of the American Society for Nondestructive Testing (ASNT) and is currently working with three ASTM committees, as well as committees at Electric Power Research Institute (EPRI), ASNT, British Institute of Nondestructive Testing (BINDT), International Standards Organization (ISO), National Fire Protection Association (NFPA) International Electrical Testing Association (NETA) and RESNET. John had the honor of becoming the first thermographer in the world to pass the ASNT Level III exam for the Thermal/infrared method. John can be reached at 802-229-9820.
Dave Sirmans joined The Snell Group in the fall of 2008 as Operations Manager for the company. He is responsible for managing and coordinating The Snell Group’s field service operations and overseeing the company’s team of technicians that offer infrared thermography, motor circuit analysis and ultrasound testing services at various locations throughout the United States. Prior to joining The Snell Group Dave worked in Reliability as lead engineer in an electrical testing company where he developed and implemented NFPA 70E compliance for their infrared inspections outfit, as well as started an engineering services division within the company. Additionally Dave founded an arc flash analysis and electrical safety training business that prospered throughout the southeast United States. He originally started his career with the US Navy where he spent eight years as an Avionics Technician and Electronics Instructor. Dave has written a number of articles for industrial publications and conferences. He enjoys hunting, fishing and coaching little league baseball, and spends most of his leisure time with his wife and children in Georgia. He can be reached at 706-636-1812 or dsirmans@thesnellgroup.com