In many cases, a structured, portable, walk-around program will suffice. In other situations, where equipment is hard to reach, inaccessible, or located in a dangerous or hazardous area, a permanent installation of sensors and surveillance hardware is necessary. Key objectives for such a maintenance program are to minimize failures, reduce downtime, and to reduce costs.
Condition monitoring tools can improve production uptime, efficiency, and profitability. Candidates for monitoring include motors, pumps, compressors, fans, gearboxes, bearings, and other critical machine elements. As components become worn, dirty, contaminated, loose, misaligned, unbalanced, and improperly lubricated, machines may experience increased vibration levels and higher temperatures, thereby leading to failures and production outages.
The tools for predictive maintenance and condition monitoring must be chosen with consideration given to a planned return on investment. Production personnel should classify machines as “critical”, “essential”, or “balance of plant”, and then decide the right mix in terms of required maintenance expertise and tools.
Careful review of needs and expectations can lead a potential user of these tools down several paths. Popular choices in this area of technology include route-based portable instruments, online continuous monitoring hardware, and predictive analysis software systems. Online systems include options for wireless or hard-wired connectivity. It is important to clearly understand the pros and cons of each offering.
Recent advances in electronics technology have allowed online predictive maintenance systems to be more affordable, reliable, flexible, and modular. These systems have proven to be quite effective in providing early warnings and pinpointing root causes for machinery faults and failures. Online systems can measure and record many process parameters, allowing the user to trend and trigger on alarms so that machine performance and health can be monitored along with vibration-related faults. There has been a natural tendency to integrate some of this data with traditional process instrumentation and control systems.
This article will focus on the recent transition to continuous surveillance systems, the economies of scale, and the distinct advantages relative to implementing a traditional portable, walk-around program. While previous experiences with such systems in this industry have brought out some areas for concern, these will be addressed as well. A specific case history and success story will be cited to show the advantages of increased awareness and improved reliability with online surveillance.
The Transition to “Online” Systems in PdM Practices
Predictive maintenance (PdM) programs have become standard in many plants; and for most corporations, the program is based on vibration analysis technology. In most cases, a company’s predictive maintenance system involves maintenance personnel using low-cost portable equipment to record the vibration data on rotating equipment, including electric motors, pumps, fans and blowers, generators, turbines and other plant machinery. This walk-around method is often time-consuming and labor intensive, and also limits personnel in making measurements in hazardous areas - and in other instances, measurements cannot be repeated.
An alternative to this approach is the on-line surveillance system. These continuous, computerized monitoring systems are designed for maintenance of critical and essential equipment, such as key production equipment in continuous processes.
For decades, the portable data collector has served as the cornerstone of many predictive maintenance programs. Capable of gathering vast amounts of data from many areas of the plant and storing it in a central database. Data collectors have been a key tool in many operations. Moreover, advances in integrating a data collector’s information with a personal computer - allowing for the data to be displayed and analyzed - have done much to propel the development of more fully automated systems.
With portable analyzers and data collectors, companies of virtually any size can implement a predictive maintenance program. However, manual data collection continues to pose certain challenges. One concern is that it can be a labor-intensive task involving highly skilled personnel. A second concern is that measurements taken with portable instruments may be inconsistent. For example, maintenance personnel may place a sensor on a different part of a machine when periodically taking measurements; or they may take readings inconsistently. On top of this, a plant’s walk-around method for collecting data sometimes exposes personnel to hazardous areas.
As an alternative, sensors and system hardware may be placed throughout the plant to obtain continuous, unattended and on-line monitoring of machinery - even equipment located in hot, wet, hard-to-reach and hazardous spots. In this application, the position or the sensor never changes, ensuring that measurements are consistent. Sensors continuously read such parameters as vibration, pressure, flow, temperature, and speed. Another important element of this type of system is the surveillance system hardware, the field-mounted data collectors/information processor, linked to a centralized computer over a local area network. The central computer workstation serves as the focal point for information storage, retrieval and analysis.
The Typical Online System Architecture
On-line systems of today provide an extensive hardware and software platform, including data collection, event monitoring, malfunction diagnostics, and on-line surveillance functions. While these capabilities might sound possible only at an enormous cost, an on-line system’s costs are minimized by the physical distribution of hardware as well as lower labor and wiring expenses. The cost of an on-line surveillance system varies from plant to plant, depending upon the total number of points monitored and the physical layout.
Open system architectures are the backbone of most on-line machinery condition surveillance systems. Using standards in communications hardware and protocol and a central database, information on product quality and process performance can be tied together and used for statistical analysis. By connecting an on-line surveillance system to an overall plant information network, potential problem areas may be pinpointed and diagnosed more quickly. And by using a modular, flexible system hardware design, personnel can easily add to the original system later without major equipment replacement or rebuilding.
At the lowest layer in the system, permanent transducers are installed with cables connecting to a central junction box for access by plant personnel. Next, a multi-channel online module is added to provide multiplexed data acquisition and the first level for checking for the effects of sensor fault or failure. Finally, pc-based processor stations are added to select each sensor input automatically and to collect and process the desired data. At this level, the data may be checked against user-defined and statistically-generated alarm levels, as well as signal threshold value, to determine machine operating status conditions. The data collector/processor also provides another layer of protection by adding a data recovery device to the system in the event of unforeseen system power loss. Once the data has been processed, it is typically transmitted to a centralized computer database via the plant data highway. (Wireless technologies can be employed at the various levels in the system hierarchy to minimize typical wiring costs.)
Since information needs vary among the different departments within a plant, predictive maintenance data must be organized so it can be shared with as many departments as necessary. Using an on-line system, acquired data can be presented in various formats, including trend displays, alarm, time to alarm, and action reports. Spectral displays, graphic analysis tools, and machinery diagnostic reports are also available. In many cases, reports are tailored to fit the specific needs of key departments such as maintenance, production, engineering, and management. Using the system connectivity available with an on-line system, individual hardware and software modules can interact with each other for the exchange of information, data reduction, sorting, and presentation.
The sensor interface module allows connectivity to a variety of transducers, such as accelerometers, velocity probes, proximity detectors, and DC inputs. Vibration transducers are selected for the vibration frequency characteristics of the machine being monitored. Generally speaking, velocity probes are designed to detect low- to mid-range vibration frequencies whereas accelerometers are designed to detect mid- to high-range frequencies. Proximity probes are typically used to detect absolute or relative shaft position and serve as an RPM (speed) reference. Other criteria for selecting the proper transducer include: machine type, operating conditions, normal operating load and speeds, environmental factors, etc. The sensor interface provides continuous on-board checks on the input signals to detect either shorts or open-circuit conditions. Multiplexing and processing of the input signals of the connected transducers are performed at this level for presentation to the next level of the system.
A second level of intelligence provides data reduction, surveillance processing, and local area network connectivity for the overall system. It also incorporates a mass storage device for local, short-term data capture. This prevents data from being lost due to hardware failure at the upper level of the system.
The top level of intelligence in the system structure serves as a user-friendly, operator interface “window to the process.” Integral HELP screens and interactive prompts arc typically included to promote the ease of system use and ready access to captured data. Along with data presentation, a variety of functions are provided, including system configuration, system diagnostics, data storage, data analysis, and expert system software.
Online System Advantages
An on-line surveillance system offers significant enhancements and an alterative to conventional manual predictive maintenance programs. The system reduces the staff time required to collect pertinent data and improves the ability to complete detailed analysis of machinery condition. Permanently installed sensors provide valuable, high-integrity data from machine locations that are virtually impossible to access with hand-held data collectors. The dedicated system approach also provides more frequency data sampling and faster diagnosis of machinery problems.
Considering the costs of portable instruments and plant labor, a machinery condition surveillance system offers an alternative for obtaining pertinent machinery data on a frequent basis. The resultant predictive maintenance program yields reduced mechanical failure, improved maintenance planning, and increased plant productivity.
Providing data acquisition, data storage, data presentation, and data interpretation, on-line surveillance systems help to ensure machinery health. With the “building block” approach design of the system, overall system operation is easy to understand. The upper levels of the system, at the operator interface and surveillance processor, direct the sensor interface to provide information on a machine-mounted sensor. Vibration data is then measured, analyzed, and retained for further action. Scan times and data “freshness” are determined by the system makeup, and the modularity and flexibility of the system allow custom configuration to meet the requirements of the installation. With the intelligence and decision making distributed down to the individual sensor interface cards, hardware failures can be tolerated at the local area network and the upper levels of the system architecture without affecting the monitoring and protection of production process equipment.
Considering the economic pressures of today, having an on-line surveillance system installed on critical and essential plant equipment will be germane to the company’s ability to offer cost-effective, quality products.
Ideal Applications and Arguments for Online Systems
Recent surveys among potential users have shown that ideal applications for such a permanently-installed surveillance system include the following:
• A machine that is considered as “critical” to the operation.
• A machine in an area that is very hard to access.
• A machine located in an area that is considered unsafe
or uncomfortable.
• A process that requires frequent data collection and
system assessment.
• A process that is event-driven or conditional, and not continuous.
• A process that requires immediate alarm notification.
• A process where there is a teaming of operations and maintenance
personnel.
Arguments have been presented in considering the pros and cons of a permanent installation versus a portable program. Table1 summarizes typical comments from prospective users.

Practicality of Online Monitoring for Surveillance
A primary consideration for an online monitoring system is to determine which machines warrant surveillance monitoring as compared to what can be accomplished with walk around (portable) or protection monitoring systems. Figure 1 provides a good representation of where surveillance monitoring has traditionally fallen in a vibration measurement condition-monitoring program.

As the graph in Figure 1 indicates, on-line surveillance systems are most commonly employed on assets that are costly to maintain and those that negatively impact production efficiency when out of service. Another key consideration is the anticipated time from the first indication of a developing problem to the actual onset of failure. For instance, if the asset is likely to fail in days or weeks, then an on-line surveillance system is the most cost effective approach. Studies have shown that an on-line surveillance system is more cost effective than walk-around (portable) systems when the required data collection interval is shorter than every four weeks. Note, however, that a typical surveillance system uses polling and input multiplexing; and it is not intended to take the place of a high-speed, quick reacting protection system with shut-down capability. Another excellent application for on-line surveillance is areas that are deemed dangerous or Inaccessible.
Surveillance systems have found widespread use in dangerous and inaccessible locations in a factory environment. Machinery that had been left out of programs in the past due to the expense of manual data acquisition in dangerous and inaccessible locations is now being added to these types of systems. This is primarily due to the attractiveness of the installed cost per point and the ease of installation of surveillance systems.
In the past, the prime reason for selecting the location for a surveillance unit was based on the cost per point of the system and the desire to utilize as many of the available channels as possible. When you are considering locations and the number of units, it is important to factor in all costs. Oftentimes, a single centralized unit is more costly than two localized units because the cost of running the signal wires can be higher than adding a second location. It is also important to check with the Information Technology (IT) or Information Services (IS) department on the availability of network drops in the areas where units are planned to be installed.
IT/IS Involvement
Getting your IT/IS department involved during the early planning stage is very important. These folks are usually the owners of the site network and they will have a vested interest in the project. Typically, they will have questions pertaining to how much traffic will be produced, at what speed it will be running at, and what protocols will be used. They will also hold the key to your local area network (LAN), its configuration and limitations. They will be the ones who can help with the connection to the network, and they should be able to answer specific local questions. The IT/IS department will need to help determine if a simple hub is all that is required, if there is an available router, or if it will be necessary for you to create your own LAN for the online system or if an Ethernet switch or bridge will be required. They will also be the ones to provide the static network addresses which are required, such as IP addresses and Subnet Masks. Having the IT/IS department involved up front will better allow you budget the job, be better prepared when the time comes to install the system, promote teamwork involvement, and help to create a smooth running system from the very beginning.
System Input Configuration
Getting the right information from the process is another important consideration. In mounting permanent sensors for the online system, there are some key points to note. First of all, you must consider how many sensors to use at each location. Three sensors per bearing (one per axis) would be optimal. However, physical restrictions or budgetary limitation sometimes do not allow for this. If you are faced with this issue, here are some key points to address:
• Data should be taken at each bearing,
• If limited to only one radial position per bearing, look at previous data
if available or the design of the machine for the direction most likely
to give you the first warning of a problem,
• Consider at least one axial sensor per solid shaft to look for problems
only identified from energy in that direction.
When permanently mounting sensors, you should mechanically attach them to ensure that they are solid at the point where you want them. (Remember that you are looking for a good transmission path for very small “tell-tale” signals indicating incipient failure.) If physical changes are not allowed, such as drilling and taping, an alternative is to use epoxy and glue the sensors in place. The next consideration is to get the proper wiring for a clean, reliable signal from the sensor to the electronics module. Most new vibration sensors utilize twisted shielded pair cabling to minimize Electro-Magnetic Interference (EMI). The twisted pair is used to carry the signal and are connected from the transducer directly to the input terminal. The shield must only be attached at one end to keep from creating a ground loop, thus allowing it to perform its function of protecting the signal. Other vibration sensors, as well as some process parameter sensors, may only have coaxial cable, which should be wired directly to the input. If you have chosen a central location for your online module to utilize it for several machines, you may want to consider remote junction boxes and multi-pair cable to help minimize cost.
Once the transducers have been mounted, the online unit(s) have been located, and wiring has been pulled, it is time to set up the database - complete with measurement types, channel input assignments, the polling intervals, the conditions and criteria for collecting data, the reading of tachometers and the controlling of output relays.
A typical setup screen appears as shown in Figure 2. Note that measurements have been set up with assigned channels to a specific online unit, along with tachometer inputs and LED sets for showing status relative to preset specified alarm limits.

Database Polling Process
Next, the interval needs to be specified for the polling and any criteria that are necessary for measurement. In this case, we are satisfied to gather 3 measurements daily (6am, 2pm, and 10pm) provided that the equipment is running (say above 1700 RPM). This is shown in Figure 3.

Spectral, time waveform, and demodulation (rolling element bearing defect detection) measurements can be taken on the vibration transducers. Tachometer inputs can be used to provide speed and relative phase data. DC inputs may also be included to provide key process parameters including pressure, flow, temperature, humidity, line speed, etc.
Next, we need to set up the relays for notifying the operator of alarm threshold in danger, which is shown in Figure 4.

Now that these key pieces have been addressed, we need to set up an online manager to perform the “house-keeping” chores for the data collection and placement into the database. This is a fairly simple piece of software that requires very little setup.
Database Management
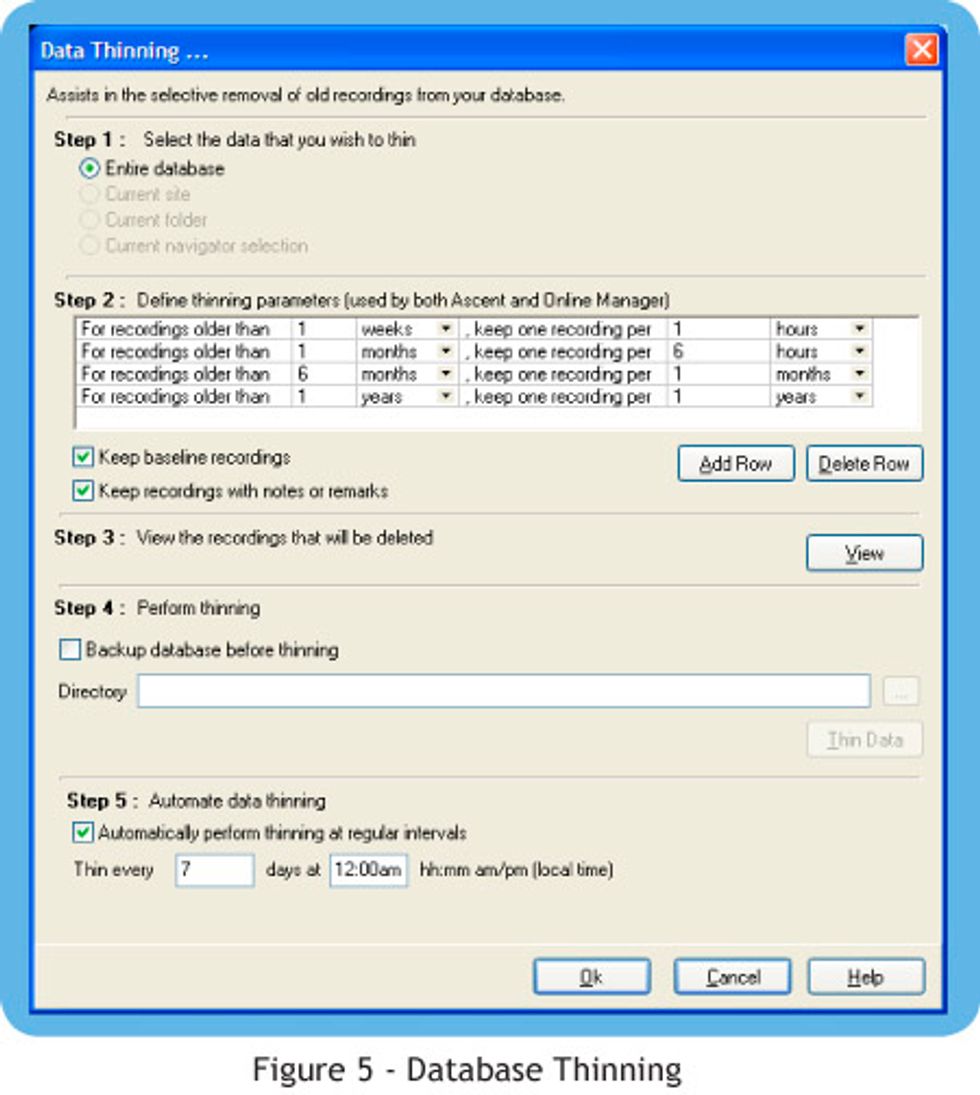
As automatic periodic data collection can lead to large database files, online manager systems usually have a thinning process built into them, as shown in Figure 5.

For example, in a system with frequent data acquisition – say once every 5 minutes, we would retain the recordings every hour for all readings older than one week.
Case History Example
With the periodic data collection now all set up and underway, it is often a good idea to go into the software to see if all is set up properly and to do an occasional “Record Now”.
In this instance, we will be taking a velocity spectrum on the Fan End bearing on FAN01.
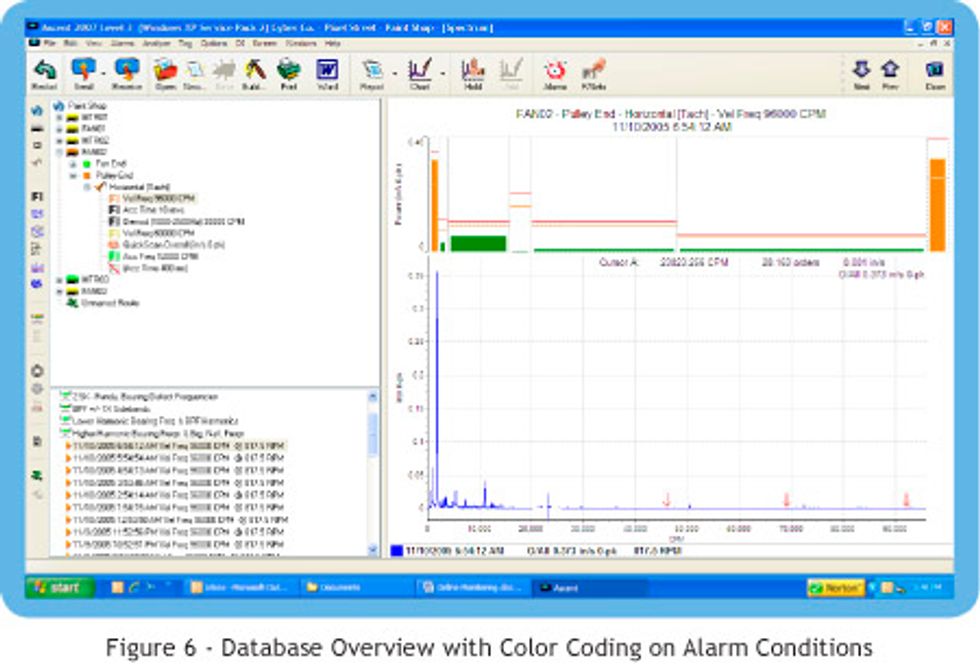
At this point, the automatic data collection process is ready to begin. As data are collected over a 24-hour period, we already start to see alarm conditions occurring, as color-coded labeling shows in the database. See Figure 6.

From this view, we can quickly see that a problem may be present on the Pulley End bearing on FAN02. The velocity reading is quite high at the motor running speed at 1792 RPM. As we also know the bearing at this point is an SKF22218CCK, we can produce a Demodulation chart that shows an inner race defect frequency. See Figure 7.

Alarming Methods
Another feature that is typically included in online surveillance is automatic alarm monitoring and notification software. Along with local notification, software can be configured to send alarm messages via e-mail addresses and text messages.
Another consideration for installing an online surveillance system for vibration and other related process variables is how it might pass its information to an existing supervisory control and data acquisition (SCADA) system for process variables integration and correlation. OPC is open connectivity in industrial automation and enterprise systems that support industry. Interoperability is assured through the creation and maintenance of open standards specifications. Most online systems conform to OPC, and the vibration database is simply published as “OPC”, which is then tied to the proper database.
Overall values of vibration and alarms are typically passed from the vibration monitoring system to the process automation system for display and integration.
Conclusions
With recent advances in technology, online surveillance systems have become very cost effective in relation to the already well-established portable (walk-around) programs. These new systems incorporate multiple input channels and are often viewed as a “data collector on the wall”. They have proven themselves to offer reliable, repeatable data for trending and providing an early warning for pinpointing potential failures and catastrophic outages on “critical” rotating equipment for production facilities. More points, more frequent data, and reporting software (virtually at the touch of a button) lead to improved maintenance, less downtime, and higher production efficiency.
Configuring and managing an online surveillance system is no longer viewed as complex and costly. Such a system is no longer earmarked as a tool to be reserved for only the most advanced vibration analyst. The tasks have been simplified considerably and are set up with interactive prompting and navigation, and they typically include self-checking menu structures.
Once a system is configured and powered on, it doesn’t take much time to see results and get payback on the investment.
Dennis H. Shreve holds B.E.E. and M.Sc. E.E. degrees from The Ohio State University, with specialization in high-speed data communications. He has 40 years of experience in designing and developing electronics and software systems and leading projects for real-time industrial process monitoring and control applications. Over the past 21 years, he has specialized in predictive maintenance (PdM) technologies and vibration detection, analysis, and correction methods for maintaining machinery health. Dennis is certified by Technical Associates as a Level III Vibration Analyst, and he is a Certified Maintenance and Reliability Professional. He is an active member of several professional societies, including Vibration Institute, SMRP, ISA, and I.E.E.E., where he has written several articles and conducted public seminars. Dennis is currently employed with Commtest Inc. as Channel Support Engineer for the Channel Partner Sales organization. He can be reached at dshreve@commtest.com or 865-862-6671.