There is no magic bullet for successful condition monitoring. There are many technologies that are very effective for preventing unplanned downtime. While there are maintenance personnel who have developed a favorite technology and lean on that more than others, ideally the approach should be to integrate as many different technologies as possible to be truly effective.
The analogy would be to go for an annual physical and have your doctor use only one instrument such as a stethoscope to listen to your heart beat. Would you be satisfied that he/she did everything possible to make sure you were healthy? Of course not; you would expect the examination to include a multitude of instruments and technologies.
The same is true of your plant equipment. The more technologies used, the more effective the program will be in diagnosing and predicting potential problems and keep the assets up and running as needed.
The most common technologies used for condition monitoring programs are often: vibration, thermal imaging, oil analysis and ultrasound. Depending on the plant and maintenance goals, two others should be considered as well. They are motor current analysis and laser alignment (there are other methods of alignment but this is the most popular form).
Vibration technology has been around for a long time and has gradually become the mainstay of many maintenance departments. Usually used for mechanical inspections, they look at frequencies that can disclose potential faults by examining the speed (acceleration) and displacement of these vibratory emissions. Frequency analysis can disclose a number of potential issues ranging from soft footing and gear issues to failed bearings.
Thermal imaging involves cameras sensitive to infrared waves that are usually associated with heat emissions. These cameras are also very popular and used for a wide variety of inspections. Most often they are used to inspect electrical equipment for potential fire or other failure conditions such as flashover. They have also been used to inspect heat buildup in motors and bearings and identify faulty valves and steam traps.
This article will detail another of the more popular condition monitoring technologies: airborne/structure borne ultrasound. We will review the basics of ultrasound technology, what is new to the technology and how it is used for condition monitoring to locate safety hazards, reduce energy waste and improve equipment availability.
Ultrasound inspection offers a unique position for condition monitoring as both a "stand-alone" inspection technology and as an effective screening tool that can speed up the inspection process and help inspectors determine effective follow-up actions for mechanical, electrical and leak applications.
Whether you refer to proactive inspections as "predictive maintenance" or "condition monitoring", the goal is the same; to note a deviation from a normal or baseline condition in order to determine whether or not to take corrective action in a planned orderly manner and to prevent an unplanned incident.
The ideal end result is to maintain asset availability, reduce maintenance overhead and improve safety conditions. Not one technology can cover everything. The recommendation is to incorporate as many technologies as possible into inspection procedures to assure reliable results.
Ultrasound Technology
Airborne/structure borne ultrasound instruments receive high frequency emissions produced by operating equipment, electrical emissions and by leaks. These frequencies typically range from 20 kHz to 100 kHz and are beyond the range of human hearing. The instruments electronically translate ultrasound frequencies through a process called heterodyning, down into the audible range where they are heard through headphones and observed as intensity and or dB levels on a display panel. The newer digital instruments utilize data management software where information is data logged on the instrument and downloaded to a computer for analysis. Some instruments contain on board sound recording to capture sound samples for spectral analysis.
Sounds are received two ways: through the air and through solid surfaces (structures). Airborne sounds such as leaks or electrical emissions are received through a "scanning" module. The structure borne ultrasounds, such as generated by bearing or leaks through valves, are sensed through a wave-guide or "contact" module.
What makes airborne ultrasound so effective? All operating mechanical equipment, electrical emissions (arcing, tracking, corona) and most leakage problems produce a broad range of sound. The high frequency ultrasonic components of these sounds are extremely short wave in nature. A short wave signal tends to be fairly directional and localized. It is therefore easy to separate these signals from background plant noises and to detect their exact location. In addition, as subtle changes begin to occur in mechanical equipment, the subtle, directional nature of ultrasound allows these potential warning signals to be detected early, before actual failure.
Most of the sounds sensed by humans range between 20 Hertz and 20 kilohertz (20 cycles per second to 20,000 cycles per second). The average human high frequency threshold is actually 16.5 kHz. Low frequencies tend to be relatively large when compared with the sound waves sensed by ultrasonic translators. The lengths of low frequency sound waves in the audible range are approximately 1.9 cm (3/4") up to 17 m (56'), where-as ultrasound wave lengths sensed by ultrasonic translators are only 0.3 cm (1/8") up to 1.6 cm (5/8") long. Since ultrasound wave lengths are magnitudes smaller, the "ultrasonic environment" is much more conducive to locating and isolating the source of problems in loud plant environments.
The high frequency, short wave characteristic of ultrasound enables users to accurately pinpoint the location of a leak, electrical emission or of a particular sound in a machine.
The basic advantages of ultrasound and ultrasonic instruments are:
1. Ultrasound emissions are directional.
2. Ultrasound tends to be highly localized.
3. Ultrasound provides early warning of impending mechanical failure
4. The instruments can be used in loud, noisy environments
5. They support and enhance other PDM technologies or can stand on their own in a maintenance program
When used as part of a condition monitoring program, ultrasound instruments help improve asset availability and save energy.
Once established, ultrasound can be used as the "first line of defense" to:
• Inspect equipment fast
• Screen out anomalies
• Set up alarm groups for detailed analysis and further action
Let's examine the possibilities of what can be done to save time, locate deviations and save energy. First listen to the translated ultrasound and observe the decibel level. Note any deviations from previous readings as you continue your route. Record the data and any sound anomalies. Then analyze the data and sounds to consider if additional action is necessary. All of this can be accomplished very quickly.
In order to understand the scope and depth of inspection opportunities airborne structure borne ultrasound offers, let's look at how the technology has progressed over the past three decades.
Initially these instruments were analog. Early versions received the raw ultrasound signal and by the electronic process of heterodyning translated them down into the audible range where users heard these sounds through headphones. Some of the instruments had intensity level meters to give the user an indication of sound amplitude. As time progressed, frequency tuning was initiated so that when confronted with a variety of test environments users could change the frequency in order to help make a received signal clearer. These instruments were all basically "search and locate" in that they were used to identify an issue. Data was manually entered on a chart or sheet.
The primary applications for these instruments were to locate leaks such as in compressed gas and steam systems and to check for arcing, tracking and corona in substations and along distribution lines.
As the industry has changed, so, too has ultrasound instrumentation. The need for documentation, trending, reporting and analysis of equipment condition has brought about changes that improve inspection capabilities and equipment availability. As these instruments are incorporated into reliability and energy conservation programs the meantime between failure rates improve along with a reduction of energy loss.
The changes in instrumentation have been substantial. No longer analog based, most of the newer instruments are digital. This allows users to view intensity levels as decibels, which provides more reliability for analysis of test results. In addition, data is now logged on-board the instruments and downloaded into data management software. The software enables users to review test results, compare current data with baseline data and trend changes. It also produces reports which can be reviewed by all involved.
In addition to on-board data logging, some of the new digital instruments incorporate on-board sound recording so that users can capture sound samples of equipment for sound analysis. The recorded sound samples can be viewed in spectral analysis software. An important feature of the spectral analysis software, in addition to viewing sound samples in spectral, time and waterfall screens, is the ability of users to hear the sound sample as it is played. Using both the visual and audible modalities in this manner adds a new dimension for enhanced diagnostics.
Being digitally based, the technology is now capable of incorporating a range of diagnostic and analytical software tools that will keep users informed of the savings generated through compressed gas surveys and steam surveys. In fact new developments in compressed gas software provides users the ability to manage their leak programs while demonstrating savings in energy and carbon gases. Should a company become involved with carbon trading, these reports can prove to be extremely useful.
Another advancement over the years has been in the area of specialized module development. Recognizing that not one receiving module can be used in all test environments, new modules have been created to meet specific needs. For example, a magnetically mounted transducer is used to test bearings to provide consistency in test approach and results.
Parabolic modules can double the detection distance of standard scanning modules and can be used to safely identify electrical emissions in transmission lines or substations without inspectors getting too close.
When equipment needs to be monitored over time or when remote monitoring is called for, remote sensors can be mounted on test points. Some of these sensors have cables that can run out to an accessible area where an inspector using a portable instrument can attach the cable end to a sensing module and log the data. Other types use 4-20 mA , 0-10V and heterodyned outputs to transmit data to a control panel, alarm or recording device.
While many of these remote sensors are used to monitor bearing wear, with the increased awareness of arc flash prevention, some of these sensors are placed in enclosed electric cabinets to alarm when arcing, tracking or corona are present.
Applications
There are three generic categories of applications in power plants: leak detection, mechanical inspection and electric inspection.
Leak Detection:
Leaks can form practically anywhere in a plant. This includes pressurized systems and systems under a vacuum. Leaks can occur internally through valves and steam traps, in heat exchanger and condenser tubes or to atmosphere.
While it is important to locate potential safety hazards from leaks, loss of gases through leaks costs facilities lots of money. One area that can show fast returns is through establishing a compressed air leak survey program. In fact, the US Department of Energy has started a compressed air challenge. The reason? They estimated that of all the compressed air used in the US by industry, about 30 percent is lost to leaks. They estimate this to cost from 1 to 3.2 billion dollars annually.1
Based on 100 psi, at a cost of $0.25/mcf for one year (8760 hours), a leak as small as 1/16" (.16 cm) can cost $846.00 annually. By doubling this to 1/8" (.125 cm), the cost jumps to $3,389.00 annually. If your plant had 10 leaks or 50 leaks, imagine the savings! We've had reports of users who, after performing a leak survey and repairing the leaks, have eliminated the use of an extra compressor.
New compressed gas survey software organizes results so that when data is downloaded, the software will calculate the cfm loss per leak in terms of dollars lost. It will also provide information on gases that contribute to the carbon footprint.
In addition to the results of the survey, the software keeps tabs on what has been repaired and what leaks have not. This helps users manage their survey and provides information on actual money saved and carbon gas emissions cut.
Here are two images of a typical compressed gas report. The report shows annualized results for both dollars saved (Table 1) and carbon gases saved (Table 2). In addition you will note that it has columns that detail leaks found and leaks repaired.


Electric Emissions
Ultrasound inspection works on all voltages, low, medium and high to detect arcing, tracking and corona in both enclosed and open access equipment. Arcing, tracking and corona ionize the air molecules around them, which produces ultrasound.
With the advantage of digital sound recording and spectral analysis, inspectors can analyze sound samples to determine the type and severity of an electric emission.
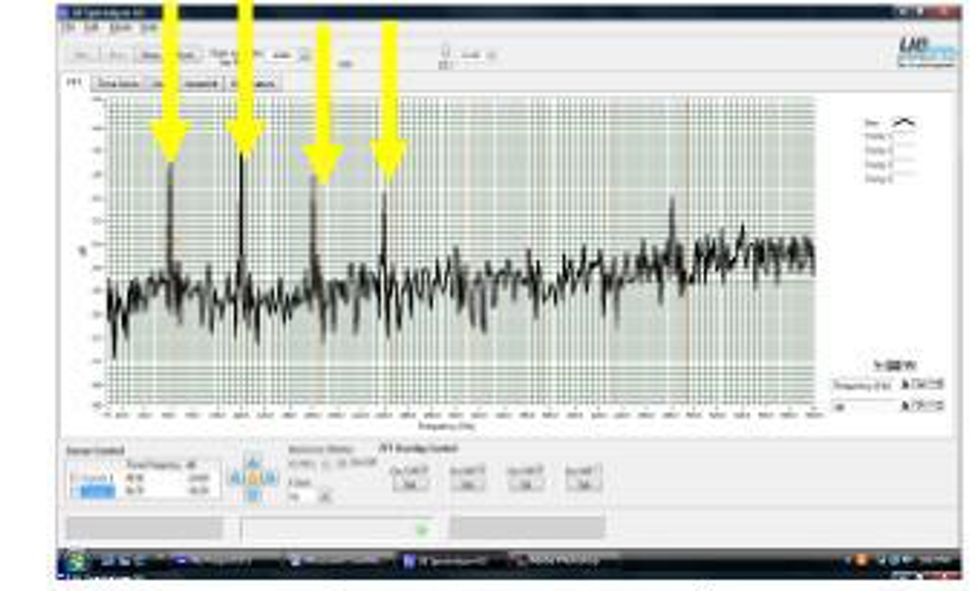
Below are some examples of corona, tracking and arcing. As you will note in the FFT screen as the condition becomes more severe, there are fewer harmonics of 60 cycles. If this were in Europe, we would see the same with harmonics of 50 cycles.
The first image is Corona (Figure 1) followed by Tracking (Figure 2) and then by Arcing (Figure 3).


The following demonstrate the effectiveness of ultrasound when used with infrared. An inspector who utilizes both ultrasound and infrared technologies was inspecting switchgear. Some of the doors could not be opened. There were no IR ports on the closed cabinets and therefore this switchgear could not be tested with infrared. By scanning the door seams and air vents with the ultrasound instrument, the inspector heard a very distinctive arcing sound. He recorded the sound and after the cabinets were opened he took visual and infrared images (Figures 8,9). Below are the results.
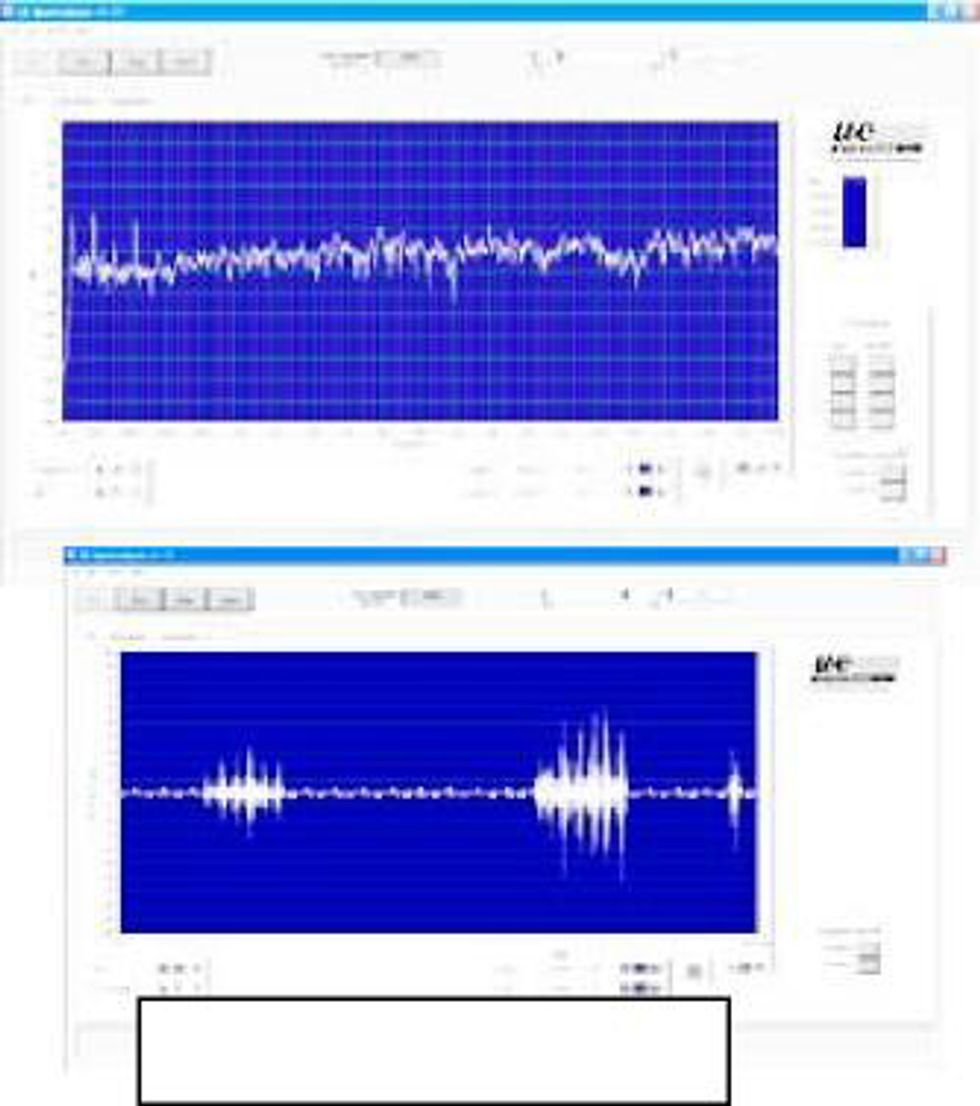
This is the spectral image of arcing (Figure 6). Below this is the time series view (Figure 7) of arcing.

The infrared image shows (Figure 8) that this failure condition could have resulted in flashover at any monent which would have produced a catastrophic event.


Mechanical Inspection
As ultrasound technology has evolved into the digital age it has created many opportunities for detecting, trending, analyzing and reporting changes in operating mechanical equipment to improve asset availability. Data can be stored, uploaded and downloaded into data management software. The software is used to produce trend charts, generate reports with selected criteria, alarm levels can be set to create work orders for equipment in need of corrective action. When changes in mechanical equipment exceed an alarm value over baseline, spectral analysis can be used to analyze sound samples for accurate diagnosis (Figures 10 & 11). Fault frequencies can be determined for bearings or gears. It is recommended that baseline readings be taken both as stored decibel levels and with recorded sound samples. Baseline sounds will be very useful in determining whether or not changes have occurred in equipment and if corrective action should be taken.


In the sample below (Figure 12), while inspecting bearings a user noticed an unusual sound in a nearby gearbox. He recorded the sound and played it back in the spectral analysis software where he confirmed the sound was in fact gear related by noting gear mesh harmonics. He used this recording as a baseline. The lower spectra line was the baseline. You will note that as the condition worsened the amplitude increased to a point where corrective action was taken.

Condition Based Lubrication
Ultrasound is sensitive to friction and for this reason it is effective in identifying lack of lubrication and also preventing over lubrication. Over lubrication is one of the most common causes of bearing failure. Condition based lubrication, as opposed to time based "preventive" lubrication programs prevent over lubrication. The traditional time based programs traditionally call for lubricating all bearings at set intervals with a set amount of lubricant. This overlooks one problem; not all bearings need lubrication or as much as called for in these procedures. Condition based lubrication utilizes the new advancements in the technology of data management and specialized sensors to determine specifically which bearings need lubrication and when the lubricant is applied, when to stop adding the grease.
Conclusion
Over the past few years ultrasound technology has advanced from using simple analog "search and locate" "trouble shooting" instruments to a comprehensive, sophisticated technology that is digitally based offering systematic approaches to leak management, electrical monitoring and mechanical inspection including bearing condition analysis and trending. They provide savings in energy and improve meantime between failure rates. Power plants can improve their efficiencies plant wide which will lead to improved productivity and cost reduction.
Article submitted by: Alan Bandes, UE Systems, Inc.
1. US Department of Energy. Energy Efficiency and Renewable Energy www1.eere.energy.gov/industry/bestpractices
Glossary of Terms:
Arcing: An electric discharge through normally non-conductive media such as air. It is a failure condition in electric equipment and can lead to fire or an explosion.
CBM: Condition Based Maintenance
Corona: An electric discharge around conductors
when the surrounding air is stressed beyond its ionization point without developing flashover. FFT: Fast Fourier Transfer-A digital processing of a recorded signal representing data in terms of its component frequencies.
IR (Infrared): infrared cameras and infrared thermometers sense the infrared (below red) light which is not detected by the human eye. These emissions are usually related to temperature emissions.
kHz: KiloHertz. One kHz= 1000 Hz or 1000n cycles per second
PdM: Predictive Maintenance
Tracking: Electricity follows a pathway to ground utilizing dirt and other contaminants until it reaches flashover.