General
Infrared thermography is a proven technique for inspecting live electrical equipment. With the installation of one or more IR windows, an infrared thermographer can examine live electrical equipment without removing panel covers.
The use of IR windows has become increasingly common over the past 10 years. This is due primarily to the increase in electrical safety awareness resulting from the widespread implementation of safety standards, such as NFPA 70E and CSA Z462. The aim of this article is to introduce the theory behind infrared transmission.
There are two kinds of IR windows: crystal and reinforced polymer. How do these materials affect readings? What are the options available to thermographers that allow for correction and more accurate problem diagnosis?
IR windows are not 100 percent transmissive to infrared radiation and so the thermal imager will be inaccurate when viewing through an IR window.
Thermographers want to measure temperature; if temperature measurement is not important, why buy a radiometric camera?

Figure 1
Let's get started with IR Window Transmission 101
Infrared transmission can be defined as the proportion of infrared radiation emitted from a target that passes through the IR window and reaches the thermal imager, thus enabling a measurement.
IR window manufacturers are often asked the question: "What is the transmission of your IR window?" Unfortunately, there is no simple answer. Most, if not all IR windows used for electrical inspection are "spectral" in nature. This means the transmission of the IR window itself changes with wavelength and therefore targets temperature.
Additionally, the apparent transmission of the IR window depends, to some extent, on the spectral response of the camera. Since the majority of predictive maintenance (PdM) thermal imagers operate in the long wave (LW) band of 8-14µm, this article will concentrate on the specific effect on this type of thermal imager.

Figure 2
Since it is not possible to achieve 100 percent transmission, where does the rest of the IR energy go?
Simple answer: It is reflected and absorbed (emitted).
The total IR energy an imager "sees" is made up of three components: Reflected, Absorbed and Transmitted energy.
Anyone who has completed a Level 1 Infrared Thermography class should remember the RAT equation:
R + A + T = 1
Thermographers are accustomed to the first two as these are inputted into a thermal imager to obtain a valid reading. However, the third is only used when there is a medium between the target and the camera. In this case an IR window.

When setting up a thermal imager to take a reading without an IR window, we make an assumption that there is zero transmission component because we have a direct line of sight to the target being measured. The energy measured by the imager (see Figure 4) is made up of:
- Energy reflected from the target,
- Energy emitted by the target.

Figure 4: Effect of IR window on infrared signals
Again, Infrared 101: R+A+T=1.
Figure 5 is a transmission schematic for a standard IR window. This schematic shows the four signals received by the thermal imager as a result of the IR window's "interference."

Figure 5: Effect of IR window on infrared signals
To calibrate an IR window, the goal is to isolate all signals other than the emitted one by using a target signal, shown in green in Figure 5.
When we add an IR window to the system, we introduce additional radiation sources:
- Energy reflected from the target and transmitted by the IR window.
- Energy emitted by the target and transmitted by the IR window.
- Energy emitted by the IR window.
- Energy reflected from the IR window.
The sum of these four values is known as the total radiance and this is the amount of energy our thermal imager registers and converts into a temperature measurement value.
The overall effect can be either positive or negative depending upon the severity of the environment and the composition of the IR window.
With regard to crystal IR windows, this article refers to data taken using CorDEX Instruments' IW Series IR windows with HydroGARD coating, which have almost zero surface reflectivity. That means we can remove the "reflected by window signal" shown in Figure 5 as a purple line.
For real-time measurements, we require high emissivity targets. Therefore, we can remove the "reflected by target signal" shown as the orange line in Figure 5.
This leaves only the "emitted by target" and "emitted by window" signals. As the IR window transmission value drops depending on material used or thickness for example, the effect of emitted energy on the imager becomes more relevant. This is particularly evident if the IR window optic temperature is relatively high.
TIP: If the IR window is hotter than the original target, then the amount emitted by the IR window itself will be higher than the camera would originally have seen had the IR window not been present. Therefore, the camera will read HIGH.
So far, we have assumed that we have an uninterrupted path to our target, which is not always the case. Some IR viewing panes use a polymer/mesh combination as the "optic." Let's see how this combination affects the camera. In Figure 6, we can see that the opaque mesh (black) has totally different transmission characteristics to semi-opaque polymer (yellow). Inconsistency due to polymer/mesh combination, focus, target temperature and window temperature makes the polymer/mesh combination impossible to calibrate over standard PdM range.
Crystal or Mesh?
The polymer/mesh IR window transmission schematic in Figure 6 shows multiple signals received by the thermal imager. For this model, we separated the signals to the camera from polymer optic and opaque mesh grid. It is clear that there are now a minimum of six signals reaching the camera, four from the polymer optic and four from the mesh grid.

Figure 6: Effect of polymer/mesh IR window on infrared signals
We can also see that the mesh and polymer behave very differently. The polymer allows some energy to pass, but also reflects and emits its own energy. The mesh, in contrast, is totally opaque, therefore the signals it transmits to the camera are reflected and emitted.
This behavior is repeated multiple times due to the mesh honeycomb. Additional problems arise when focus and angle are introduced into the model.
Polymer/Mesh Optics
- Multiple complex signals to thermal imager
- Severely affected by focus and angle
- Repeatable transmission correction is not possible
- Suitable for qualitive (non-measurement) based thermography only
Crystal Optics
- Suitable for quantitive (measurement) based thermography with transmission correction algorithm
- Simple, repeatable signals to thermal imager
- Minimal surface reflection
- Does not affect target focus
We have established it is not possible to correct through mesh, SO, WHAT NEXT?
Calibration Basics
Standard instrument calibrations are performed at set points across the process variable (PV) range. Traditionally, IR window calibrations have been related to a single point calibration, also known as a 'coffee cup' calibration.
In order to obtain accurate readings across a range, a correction curve must be created. Typically, calibrations go across a range of: 0 percent, 20 percent, 40 percent, 60 percent, 80 percent and 100 percent. This allows the instrument to be accurate at multiple points.
Since a thermographer is interested in trending temperature over time to extrapolate a failure before it occurs, calibration over a range is the ultimate goal when it comes to accuracy.
Calibrating for Transmission
The traditional coffee cup test procedure is:
- Insert the window between the cup and the camera and record the reading.
- Alter the emissivity to bring the camera temperature reading back to pre-window.
- Set the camera emissivity to 1.
- Point the camera at the hot cup of coffee, making sure it is in focus, and record the temperature.
- Multiply the value shown by the emissivity of the next target and that is the transmission of the window.

Figure 7

Figure 8
To highlight the limitations of single point calibrations, we will apply the coffee cup test to a range and measure the results using an IW series intelligent IR window and long wave thermal imager. Try it for yourself!
Coffee Cup Test Results at a Higher Temperature
Figure 9 shows two sets of results. One shows the initial calibration temperature where accuracy is 2 degrees. The second set of results shows the same calibration figure applied to a higher range, in this case 238 F. In this example, the camera returns a temperature of 272 F, which is high by 34 degrees.

Figure 9: Transmission results across a range
- Coffee cup calibration is only accurate at single point.
- Readings are inaccurate as temperatures change.
- If tested above coffee cup test temperature, camera reads high, thus meaning potential false alarms.
- If tested below coffee cup test temperature, camera reads low, thus meaning potential missed problems.
Figure 10 shows the effect of a single point calibration over a range. At the calibration point, the camera is accurate. However, as the same calibration factor is applied to increasing and decreasing target temperatures, significant errors occur.

Figure 10: Single point calibration applied to a range
Single point calibrations are inaccurate when applied to a range.
Multipoint Transmission Correction
The ultimate goal is to create a correction map that provides accurate readings over a range of target temperatures. The aim is to achieve a ±5 degree target accuracy after calibration. While this is outside the standard camera accuracy, it is more than adequate for electrical inspections. When creating the map, it is essential to isolate erroneous signals that will affect the result.
Challenges:
- All IR windows, even those using the same material at the same thickness, will exhibit slightly different transmission results.
- Transmission maps must be individual to each IR window. A typical electrical PdM range of 85 F to 330 F requires a minimum of five calibration points to be in line with standard instrument calibration protocol.
- Spectral responses of individual cameras change from one to another. This will always create an error, but generally will be within the ±5 degree target accuracy.
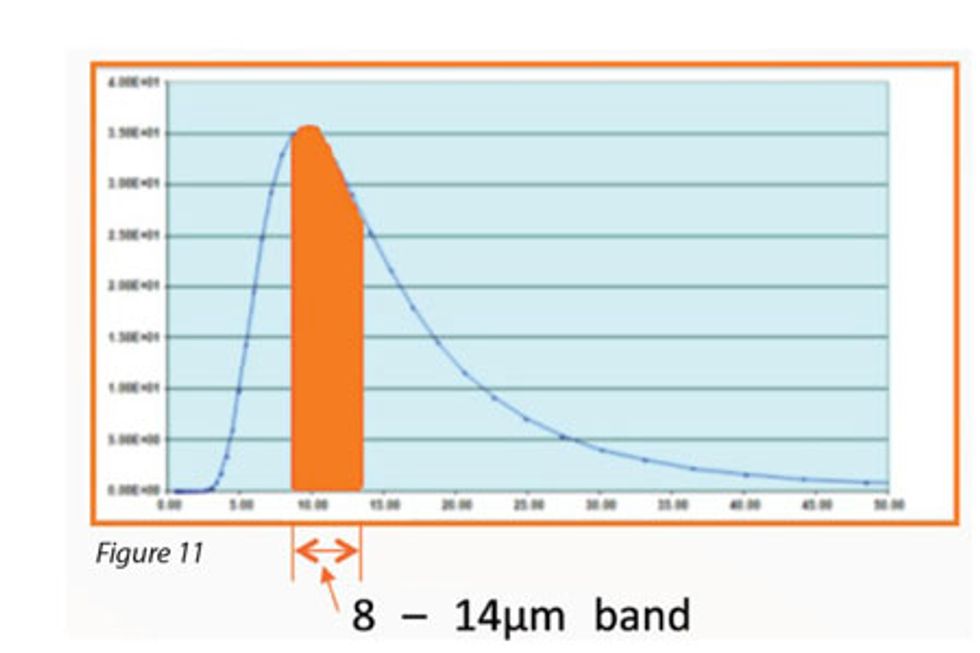
Multipoint Calibration
Total radiant energy detected by a thermal imager in the 8-14µm band is the area under the curve that equates to temperature when the imager is calibrated.

Figure 11

Figure 12
With an IR window between the imager and the target, the amount of energy received by the thermal imager is, in this instance, shown in green in Figure 12. The calibration factor is the multiplication value required to increase the green area to orange.
The curve for hotter temperatures moves into the shorter wavelengths, whereas the curve for colder temperatures moves into the longer wavelengths. The Planck curve "moves" along the IR spectrum depending on the target temperature.
Since the transmission of the IR window is better in the shorter wavelengths, more energy is transmitted by the IR window from hotter targets than from colder targets, which transmit more on the longer wavelengths.
A material having the ability to change transmission rate as a function of target temperature is known as a spectral transmitter.
A camera monitors in the 8-14µm band, but energy changes within this band at different target temperatures. A spectral transmitter modulates the energy as a function of wavelength, which means a single point is insufficient to calibrate accurately.
Changes in Camera Response
Individual thermal imagers all have different spectral responses. This is a characteristic of individual detectors as they come off the production line. These differences do not affect thermographers in general, as the camera is calibrated. The effected only become "visible" when a spectral transmitter is placed between the thermal imager and the target.
All three cameras "see" slightly different radiant energy levels for the same target temperature. The cameras all read the same, as they are calibrated to "understand" that this specific level of intensity equates to a specific temperature. However, this will cause an error when used with a spectrally transmitting IR window.

Figure 13
Putting it all together
To stand a chance at reasonably accurate transmission correction via an IR window, a multipoint "map" must be created to take into account the changing parameters and their corresponding impact on temperature readings.
- A multipoint correction map is created across the identified PdM range and made available to thermographers.
- Distance to targets, ambient humidity and optic temperature are all considered and corrected from within the map.
- Multiple points are considered when creating the map, far exceeding the standard five instrument calibration requirements.
Previously, infrared thermographers have requested transmission curves from IR window manufacturers. In reality, a transmission curve has little use because it doesn't provide the thermographer with the information required to obtain an accurate reading.
What the thermographer actually needs is a correction map, similar to the one shown in Figure 14. The curve correlates the indicated temperature as shown by the thermal imager and the actual temperature of the target across a range.

Figure 14:. Typical IR window correction map
Target accuracy of ±5 degrees is the goal, but does it work.....
Figure 15 shows a series of results using a longwave thermal imager from a leading manufacturer and a transmission map for an intelligent IR window.

Figure 15: Corrected results vs. uncorrected results
It is clear that without the correction, the error is severe. However, with the correction map applied, far more accurate readings can be repeatedly obtained across the established CM range.
 Mr. Tony Holliday currently serves as Managing Director at CorDEX Instruments Ltd. Tony served as IR Windows General Manager at Fluke Electronics Corporation until April 2011. A trained engineer and published author, Tony has been responsible for improving worker safety and reducing plant operational costs by developing new and innovative products and has presented electrical safety papers at key safety conferences across the United States. www.irwindows.com


 Mr. Tony Holliday currently serves as Managing Director at CorDEX Instruments Ltd. Tony served as IR Windows General Manager at Fluke Electronics Corporation until April 2011. A trained engineer and published author, Tony has been responsible for improving worker safety and reducing plant operational costs by developing new and innovative products and has presented electrical safety papers at key safety conferences across the United States.