INTRODUCTION
In 1961 a joint task force consisting of FAA (Federal Aviation Administration) and US airline company representatives reported its findings on the effect of scheduled maintenance and aircraft reliability. They stated "In the past, a great deal of emphasis has been placed on the control of overhaul periods to provide a satisfactory level of reliability. After careful study, the Committee is convinced that reliability and overhaul time control are not necessarily directly associated topics." Further studies that also supported this precept and efforts to determine just what does maintain reliability, led to a new discipline which eventually became known as "Reliability Centered Maintenance" - a set of principles and methodology to objectively determine the appropriate type and level of maintenance to maintain required asset functionality.
Reliability Centered Maintenance has been the subject matter of many papers and its success at both saving maintenance and operational dollars, while at the same time increasing reliability of equipment and systems, is worthy of many more. Criticality analysis, root cause failure analysis, condition monitoring and other tenants under the RCM umbrella have been responsible for this success. For this discussion, however, the subject shall be limited to just one of the principles of RCM - Hardware may wear out or have random failure - Random is more common - and the U.S. Navy's findings in regard to this principle. Specifically, this paper shall present the findings of SUBMEPP (Submarine Maintenance Engineering, Planning and Procurement), a field activity of Naval Sea Systems Command (NAVSEA). SUBMEPP, as NAVSEA's technical agent for submarine non-nuclear life cycle maintenance planning, provides maintenance products and engineering services to the fleet.
Inherent to most RCM seminars is the presentation of the Age and Reliability curves displayed in figure 1.

Figure 1. Age and Reliability Characteristic Categories
The graphs depict equipment failure rates (y-axis) vs. service time (x-axis). These curves and the associated population percentile applicabilities have helped dispel the long held notion that equipment reliability fits the so-called "bathtub curve". The bathtub curve theory, which postulates that equipment suffers higher than normal rates of failure early in its life (infant mortality), followed by lower and steady rates of failure for a time period, with an eventual wear out age at some defined time period, represents only 3-4% of sampled equipment populations according to three studies accomplished by United Airlines, Broberg (1973) and the U.S. Navy (1982 MSP). While the majority of sampled equipment populations did experience infant mortality, in general, 90% of the population did not experience an identifiable wear out period. The Navy results are an exception to this generalization. 20% of the Navy population did experience an identifiable wear out period. This has been attributed in part to the corrosive marine environment that affected many of the sample population. Also noteworthy was the finding that the population majority in the Navy study did not suffer infant mortality. This has been attributed to the fact that navy vessels, systems and components are thoroughly tested and "run in" prior to being put into service. Infant mortality certainly exists, but many instances of it are not on the "radar screen". While no one should accept these findings at face value without reviewing them in the context of each individual study, these curves have been used to demonstrate the precept voiced back in 1961 - that random failure predominates.
SUBMEPP began classical RCM analysis in 1995 for non-nuclear submarine systems. In 1998, SUBMEPP developed the capability to generate Age and Reliability curves utilizing maintenance data imported from the Navy's 3-M OARS (Maintenance and Material Management Open Architecture Retrieval System). This provided the organization a new means to objectively measure the effects of planned maintenance to engineer optimal maintenance plans. In turn, this progressive initiative significantly advanced SUBMEPP's ability to cost effectively maintain safe, reliable and mission capable submarines. After three years of generating Age and Reliability curves SUBMEPP is ready to report that the 1961 finding still holds true. In the majority of cases there is no relationship between overhaul time and reliability. Random failure predominates.
Past Ability to Profile Age and Reliability Relationships
SUBMEPP develops maintenance requirements following traditional RCM methodology and with the assistance of an RCM software application they developed in 1995. The application includes a Preventive Maintenance Task Evaluation module and within that module, the application questions the engineer whether certain task types would be applicable and effective in preventing those failure modes they have attributed to the equipment being analyzed. Specifically, the engineer must identify realistic root causes to failure and navigate through an Applicability and Effectiveness Logic Tree to prescribe maintenance tasks that work to prevent failure or reduce consequences of failure to an acceptable level. For non-safety related failures, those tasks must pay for themselves as well.
Among the optional task types, which include servicing, condition monitoring, condition directed, and failure finding, are time directed tasks. For a time directed task to be applicable (1) the failure mode must be wear or age related, (2) the probability of failure must increase at an identifiable age and (3) a large proportion of the items must survive to that age. To adequately determine the applicability of the task, therefore, a relationship between time and reliability must be demonstrated. This is most effectively accomplished by a regression and correlation analysis of failure rates and age.
Traditionally, the submarine technical community has specified engineered periodicities for all submarine components. An engineered periodicity is the maximum amount of time that a component can operate without being replaced or renewed through overhaul. These time periods are conservatively established to replace or renew well ahead of equipment wearout. In the past these time periods were typically established utilizing manufacturers recommendations and the collective input of the cognizant naval technical community. More often than not these periodicities were subjective and not derived through an objective and thorough analysis of lifecycle feedback data. This approach to maintenance was also the preferred means of ensuring equipment reliability.
As a result of the technical and cultural change undertaken by the submarine community toward condition based maintenance, it has now become necessary, as mentioned above, to demonstrate evidence of an age relationship to unreliability. In the not too distant past at SUBMEPP, this was a difficult task. It required an engineer to sift through reams of paper containing 3-M data, mailed by the folks at Naval Sea Logistics Center. The engineer would identify failures, tally them and determine if the older components suffered more failures than the younger components. Complicating matters was the fact that boat age usually didn't correlate to component age. And so the engineers struggled in their effort to determine if and when a time directed task would have the desired effect of improving reliability. Again, as before, that decision was more of a subjective one.
Current Ability to Profile Age and Reliability Relationships
SUBMEPP now has the capability to profile age and reliability relationships rather easily through computer automation. The journey to that point was a challenge however. Age and Reliability curves are difficult to construct. One of the more challenging aspects is the process of defining the population. All assets that experienced a failure, or had the opportunity to experience a failure, must be accounted for. All opportunity periods, not observable due to information system constraints, must be accounted for as well. The population for each age interval, for any entity studied, is typically not constant and may vary for each point along the x-axis. Asset populations for navy vessels are dynamic. Each year new vessels are brought on line and old vessels are retired. Asset lifecycles vary as well, depending on what maintenance was accomplished for each individual asset. Another complication is the requirement that all failures be identified to a known asset of a known age.
SUBMEPP's Feedback Data Analysis System is a homegrown application developed after much time and effort with legal pad, pencil and PC. It is essentially a front-end application, with connectivity to 3-M OARS, utilizing common commercial-off-the-shelf database software operating in Windows. This type of analysis can also be accomplished with spreadsheet software, however this is generally not feasible without the support of a database. Some commercially available Computerized Maintenance Management Systems feature this capability as well.
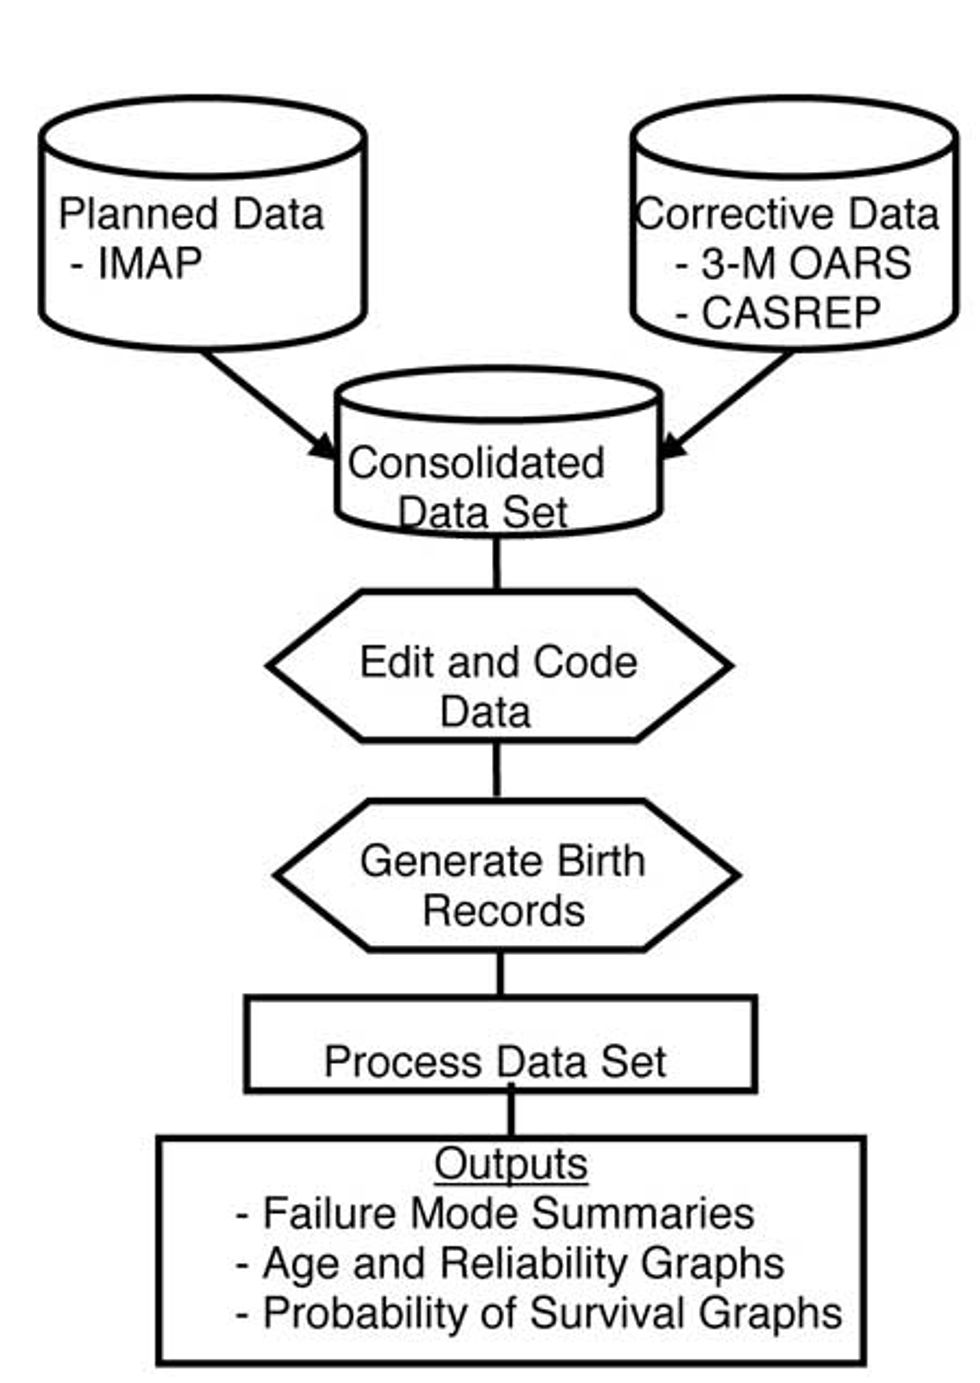
In assessing a component's reliability as it ages, there are three types of data records to be assembled - corrective maintenance, scheduled maintenance and component "birth" records. Corrective maintenance records are the source materials in identifying and counting component failures. Scheduled maintenance and birth records provide essential dates to compute population ages and each component's length of service time when failure occurs. These records are imported both externally and internally to populate a database file in SUBMEPP's data analysis application (see figure 2). The majority of corrective maintenance records are retrieved through an open database connectivity (ODBC) interface with 3-M OARS at NAVSEA LOG Center. The specified criteria for these records are usually little more than the subject component's Allowance Parts List (APL) number. Casualty Report (CASREP) data are retrieved from SUBMEPP's Integrated Maintenance Analysis Profile (IMAP) database. Scheduled maintenance records are retrieved from IMAP as well. Once selection criteria are known, the retrieval process, for all records except birth records, takes only a minute to execute.
It is recognized that not all-component failures are reported to these information systems, although the lion's shares of them probably are. The captured failures provide a representative sample of all age groups however. While the failure rate magnitude is affected by any unaccounted failures, the comparison between age groups should not be. In other words, those unaccounted failures should be scattered randomly and proportionally across all age intervals.

Figure 2. Feedback Data Analysis Process
Finally, to complete the assembly of necessary data records, the engineer must define the population of study to originate component birth records. The population must be born in order to study the effects of aging. This is accomplished by identifying through a selection menu those boats that are within the field of study. Typically this is an entire submarine class or a subset of that class. The final element in defining the overall population is to quantify the set of subject components onboard each boat by uniquely identifying each component, i.e. Trim Pump #1, Trim Pump #2, etc. Once the population is defined, the application automatically generates birth records utilizing submarine Post Shakedown Availability (PSA) dates that are contained in a resident table. PSA, the end of a trial period following commissioning, denotes delivery to the fleet and the commencement of 3-M OARS surveillance.
Corrective Maintenance records must be edited and coded by an engineer or analyst to enable processing of the data set. Some records provide too little information to discern whether a failure occurred or not and those records are invalidated. The application automatically consolidates multiple records having the same job control number. Coding of corrective maintenance records is accomplished to align the data with the ongoing RCM analysis. Each record is assigned a pre-defined failure mode, which corresponds to those failure modes identified by the engineer in the Failure Modes and Effects Analysis (FMEA) module of the RCM application. Additionally, because some corrective maintenance records are discrepancies that do not impair component functionality, the engineer identifies whether the failure mode was a functional failure or not. To gain efficiencies, the application is designed to facilitate batch coding in tandem with key word searches.
The objective is to graph component failure rates based on units of service time. The failure rate is defined as the percent of the population that failed during the observed time period. At a minimum, each valid corrective maintenance record must indicate the boat it is attributed to and the date of the failure. For each valid failure, the "time of service to failure" (age) is calculated during a processing cycle of the application. The age of the component at failure, expressed in months, is determined by subtracting from the date of component failure, the lifecycle origination date. If a component has not been renewed during its lifetime, that date is the PSA date.
Age = Failure Date -
Lifecycle Origination Date
Equation (1)
Lifecycle Origination Date = PSA Date or
Last Component Renewal Date
Unit of service time is a parameter established by the engineer and it determines the number of plotted points along the age time line (x-axis). The engineer prescribes the age group duration for which a probability of failure is calculated, and generally that duration is twelve months. Lengthening the age duration serves to dampen fluctuations in the scatter graph. Once an age is computed for each failure and the time span per age interval is prescribed, the application counts the number of failures experienced for each successive interval. Table 1 exhibits a failure count for three age intervals that was derived during an analysis of SSN 688 Class Salvage Air Valves.

Table 1. Failure Counts per Age Interval
For continuation of article click here