Greater reliability is the gateway to improved safety, throughput, quality responsiveness and cost. It can provide competitive advantage for manufacturing, medical, pharmaceutical, utilities, food processing, chemical production, metal forming, assembly, military and many more industries. Understanding what is attainable, knowing how to get there and implementing reliability & maintenance (R&M) best practices can provide that opportunity. This 2008 benchmarking study is a repeat of a similar effort performed in 1991. Specifics regarding 1991 and 2008 comparisons for North America are available from the University of Tennessee - Reliability & Maintainability Center website (www.RMC.utk.edu). For purposes of comparison in this study, the reference “Global” refers to everything except North America (which includes the United States, Canada and Mexico).
The definitions for this study remained the same as the last study.
• Predictive maintenance refers to compiling and analyzing
machine condition data to warn of impending failure and
identify defective parts (examples include vibration and
motor current analysis, infrared thermography, and oil
analysis).
• Preventive maintenance uses scheduled routine inspections
and improvements to intercept failure (examples are time-
based adjustments, replacements, lubrication, and
refurbishments).
• Reactive maintenance refers to emergency breakdowns
and related repairs.
Responses were compiled from 217 companies across North America. About 70% of the responses were from manufacturing companies, with the remainder being almost equally split between the remaining categories. The responses were grouped into five categories. Below are examples of the types of companies included in each category.
Manufacturing – automotive stampings (small & large), plastic parts, locomotive parts, machinery, sound systems, conveyor systems, fasteners, ceiling tile, air tools, aircraft, batteries, signs, transmission components, truck accessories and shipping racks.
Assembly – small instruments/equipment, CMM machines, tools, sunroofs, electrical products, automation equipment, automobiles, welding & assembly equipment and automotive components.
Process – steel, chemicals, foods, precious metals and mining.
Distribution – safety products, pumps, instruments, valves, tapes/adhesives, hardware parts and metal products.
Consultants & Other – consultants, hydraulic component repair, tool & die, construction, filtration services, equipment repair services and research & development facilities.
For Global, 75 responses were compiled into one category. Included was participation from Africa, Australia, Austria, Brazil, China, Czech Republic, France, Germany, Hungary, Italy, Peru, Portugal, Spain, Sweden, Switzerland, United Kingdom and more. The companies had an overall mix (types and sizes of companies) similar to North America.
The intent was to collect Actual (current) and Perceived World Class data, two ratios expressed as a percent (Maintenance Expenditure to Original Investment in Machinery and Equipment, and Maintenance Expenditure to Sales Dollars), and several other R&M related questions.
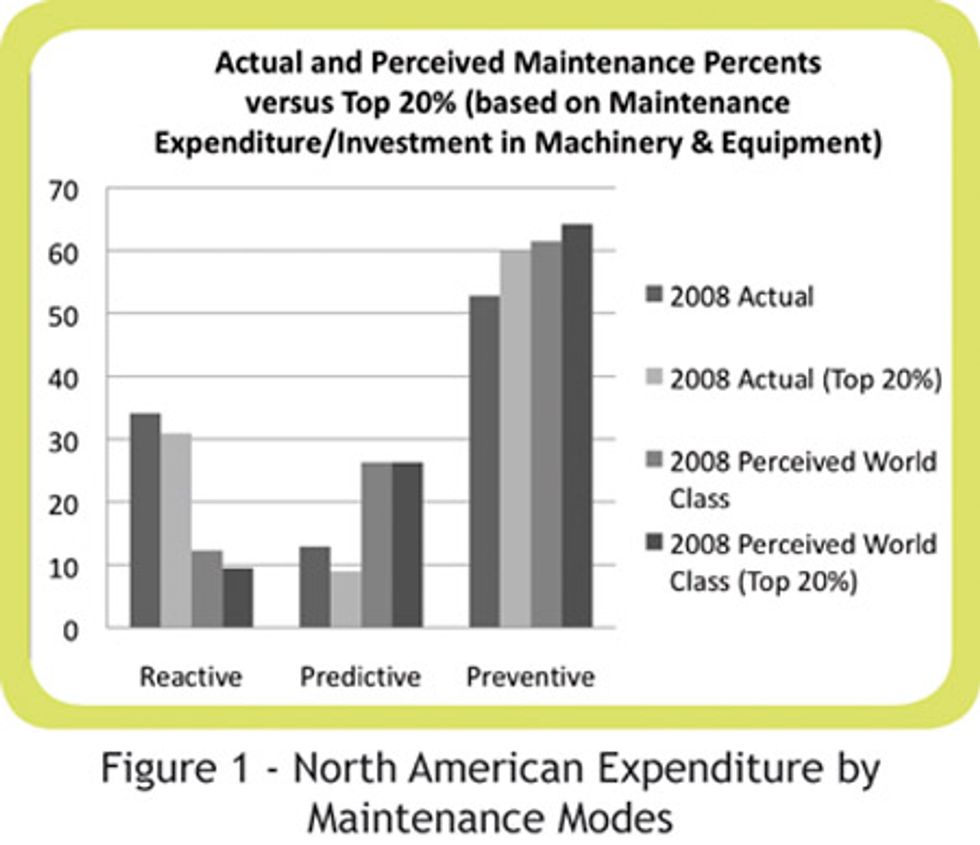
Most of the experts say that about 65% of your Maintenance should be Preventive tasks (15-20% time-based PM’s and 45-50% Corrective PM’s). The Corrective PM’s should be 15-20% resulting from PM checks and 30-35% resulting from Predictive Checks. Predictive Checks should be about 25% and Reactive about 10% (lower is better). So, 65%+25%+10%=100% of your tasks. Note that Figure 1 supports these statements. Look at the Perceived and Actual World Class Percents on the chart in Figure 4 which illustrates these same numbers.

Figure 2 shows that Global companies had 18% Predictive Maintenance work (5% more than North America which is at 13%) resulting in less Reactive Maintenance. Note that in Figure 1, North American companies responded that World Class is about twice what they are doing now in Predictive Maintenance.

Figure 3 suggests that North American companies, on average, do slightly better than Global on Maintenance Expenditure (expressed as a percent of original investment in machinery & equipment). However, when comparing the Top 20% companies, Global does better at 1.5% versus 2.7% for North America.

Proactive Maintenance (100% - Reactive Maintenance) is about 70% and Perceived World Class is about 88% for the Top 20% companies (North America and Global). However, as shown in Figure 4, North America is at 65.9% Actual Proactive Maintenance while Global is at 72.4%. Maintenance Expenditure expressed as a percent of Sales Dollars depicts relatively close values for both North America and Global in Actual and Perceived World Class (all between 4.4% and 4.8%). Note that North America was at 2.4% versus 4.0% for Global, when comparing the Top 20% companies. The 1991 values from a similar study by the author highlights the improvements made over the 17 year period.

Figure 5 is the result of responses to “What major changes do you envision in Reliability & Maintainability in the next 10 years?”. Similar answers were grouped and tallied. The majority of the responses converged on the six categories shown. Here are some observations from the data:
• North America placed People & Cultural Improvements
on top with 26% of the responses and More Sensors &
Timely Feedback as the sixth category with 6%. The
remaining categories of More Design-In Reliability &
Maintainability, More Data Driven Processes & Tools
(including Predictive), Maintenance Process Improve-
ments, and Specific Maintenance Improvements were
in the middle and more closely grouped together.
• Global placed Maintenance Process Improvements on
top with 28% of the responses and also More Sensors
& Timely Feedback as the sixth category with 5%.
• More Design-In Reliability & Maintainability was the 2nd
highest response for both North America and Global. When
combining all of the responses (North America & Global)
People & Culture are still the highest category, but More
Design-In Reliability & Maintainability is very close behind it.

Figures 5.1 to 5.6 provide more detail behind each of the six categories. Within each category, items that North America and Global had in common are in black. North America only responses are in blue and Global only responses are in green.
• Note that for People & Cultural Improvements (Figure 5.1),
Global wants to focus more on better cooperation with
machine suppliers. North America wants to focus more on
improving the culture (management, operator, maintenance).
The remaining areas listed, such as more production
operator involvement and add/hire full-time Reliability &
Maintainability Engineers are common to both North
America and Global.
• Standardized components/replacement parts, better use
of R&M in decision making, and component reliability
improvements were frequently mentioned by all (Figure
5.2). For more design-in reliability & maintainability, the
Global focus was mainly on maintainability, while the North
American focus was on both R&M. North America frequently
mentioned standardized controls architecture and Global
often referred to reduced complexity.
• Figure 5.3 lists items under More Data Driven Processes &
Tools. Both North America and Global often listed better use
of Predictive Tools, which is consistent with both of their
other responses indicating that not enough Predictive
Maintenance is being done. Perceived World Class Predictive
Maintenance for North America and Global was at 26.3%
and 28.1% respectively. It was interesting that mainly
North America mentioned OEE (Overall Equipment Effect-
iveness) and better data on the lifespan of critical
components. Meanwhile, Global mentioned better trend
analysis. All mentioned better use of data to drive KPI”s/
improve process and better integration of SPC and
R&M metrics.
• Maintenance Process Improvements (Figure 5.4) had varying
response themes that were specific to North America and
Global. In common was implementing a full TPM process.
• Specific Maintenance Improvements (Figure 5.5) shared the
focus on both, better inventory/spare parts control and lubri-
cation program. It was notable that only North America
often pointed to more kaizen events.
• Figure 5.6, Better Sensors & Timely Feedback shared similar
direction on more machine self-monitoring/feedback, error-
proofing and real-time feedback for North America and
Global.

Figure 6 is the result of compiled responses to the question “What has positively Impacted maintenance in the last 5 years ?”. The high, medium and low responses were weighted and normalized to 100%.
• More Reliable Machinery & Equipment and Better Management
Understanding of Maintainability/Reliability were the top two
categories for this question, for both North America and Global.
• The two lowest categories were More Designed-In Maintain-
ability and More Involvement by Operators for both North
America and Global. These two areas can also be viewed as
having the largest opportunity.

Figure 7 is the result of respondents self-rating their Maintenance Process (now, 5 & 10 years ago) on a 10 point scale. This data was further broken down by five Type of Industry categories and Global. This supports the improvements shown from 1991 in Figure 4.

Figure 8 illustrates Breakdowns Categorized by Percent Predictable and Random. It appears that about half of the breakdowns (57% North America, 46% Global) are random or believed to be random.

Figure 9 presents the North American trend of decreasing Maintenance Expenditure/Original Machinery & Equipment Investment with greater Levels of R&M Practices. The area of operation of the Top 20% companies in North America & Global is also shown.

The positive impact of Proactive Maintenance on Maintenance Expense in North America is illustrated in Figure 10. The 1991 and 2008 trend lines of the North America Top 20% companies are provided, along with the Best Companies area for North America and Global. A key message is that most companies are improving, so if your company is not getting better, it’s actually falling behind. Plot your Maintenance Expense and Proactive Maintenance and mark that as point A. Then what is it worth going from point A to point B for your plant/company?

Klaus Blache has over 35 years of experience in various areas of manufacturing and lean. This includes areas such as lean process assessments/improvements, reliability & maintenance, competitive analysis, benchmarking, new facility planning and implementation, industrial engineering, ergonomics/lean medical, and change management. He has written and lectured globally in numerous technical and management areas.
His education is a B.S. in Industrial Engineering (General Motors Institute), M.S. in Plant Engineering (Wayne State University), MBA with Strategic Analysis focus (University of Michigan), and Ph.D. in Civil/Mechanical Engineering (Wayne State University).
Klaus is currently at the University of Tennessee, Knoxville as the Associate Director of the Reliability & Maintainability Center (www.RMC.utk.edu) and Research Professor (College of Engineering).
His most recent corporate assignments were Manufacturing Engineering Director (design/build/operate new Cadillac assembly plant enabling lean best practices) and Engineering Launch Manager (new SUV assembly plant). He has taught over 200 lean/reliability courses in industry (such as practical problem solving, change methodology, energy management, TPM, workplace standardization, 5S, visual controls/ error proofing, continuous improvement, etc.)
In putting this article together, he called on his background in global benchmarking, implementing a plant-wide lean culture & process, managing the General Motors Corporate Industrial Engineering/Maintenance and Reliability Group and numerous related plant assignments. Klaus is also a past Chairman of SMRP. He is a regular presenter and keynote speaker at conferences. He can be reached at kblache@utk.edu .