In a major market shift, disruption, or downturn, cost cutting may be essential. But even before the current situation and major downturn, most manufacturers had already cut costs substantially, even “to the bone” some would suggest. Now, many of those same manufacturers have announced even more cost cutting and major layoffs. They may be engaged in what Gary Hamel referred to as corporate liposuction – they had already sucked the fat out, and now they’re unknowingly going for the vital organs. How do we manage under these very difficult circumstances, when demand has suddenly plummeted? How do we position our businesses to survive in the short term, and perhaps even more importantly prosper on the backside of this recession?
Jack Welch recently wrote that during this difficult time you should “Cut costs deeper than you’d like, fixate on operational details to wring out all the excess, and focus on cash as if your life depends on it.” Most companies probably thought they had already done this, or were actively doing it. He went on to write “Do everything you can to buy or bury your competition.” The problem with the advice is that if you cut costs too much, your business will be crippled over the long term, and unable to “buy or bury the competition.” It may not even survive. Consider that GM and Ford have engaged in cost cutting for years, even decades. It doesn’t seem to be working for them. Whereas, Toyota works on continuous improvement – removing the waste and defects in their systems, engaging their employees, and constantly working to “wring out all the excess (or waste)”. But, not even Toyota is immune to the current downturn, and is cutting temporary and part-time positions.
Costs are a consequence of your processes. Numerous studies, and my personal experience working with hundreds of manufacturing plants, indicate that cost cutting has a very low probability of success. As noted, in a major market shift or disruption, it may be necessary. In manufacturing, it will be even more tempting, or even necessary, to cut costs, particularly maintenance costs. But, if we go too far, we will cripple the assets and leave the business at great risk of failure in the future.
How do we get lower costs in these difficult times? What should we do so that we can survive, and then prosper? Maybe even “bury the competition”? Below are several thoughts.
Sell/Shut Weak Plants or Divisions
If you must do cost cutting, it is most likely to be successful if it is based on structurally realigning the business. That is, selling or shutting down the weak performers, particularly those in weak or declining markets. As you might know, this is much easier to say than to do. But some questions you could ask, among others, in making these decisions are provided below.
1) Production Costs. Which units have the highest production costs? Are these likely to change in the future, from either internal improvements or structural changes, for example in raw material supply costs, quantities, or quality? Which units have the lowest production costs? And, are these sustainable, or likely to change in the future? Are any particular plants better positioned technologically? What advantage do they provide in the market place?
2) Product Lines. Which product lines have the lowest gross profit margins, both unitized? And overall? Which have the highest? Are these likely to change? Why?
3) Markets. What is the trend in our markets? For each, are they growing? Steady? Declining? What about the gross profit margins in each - growing, steady, declining? How to we position each product line in each market? What wins orders in each market- price, delivery, quality, packaging, technical support, etc.?
4) Structural Advantages. Do any production plants or product lines have particular structural advantages, e.g., lower, long term energy costs, patent protection, higher yields from raw material, significantly better technology, etc.? Are these advantages sustainable in the longer term?
Optimize Product Mix/Customers
Following up on paragraph two and three above, review all product lines and product mix – cull those that add little value to the business. For example, develop a matrix for managing all Products/Stock Keeping Units (SKU’s) based on volume for each SKU compared to profit for each SKU. Use this to make judgments about 1) eliminating low volume/high cost products, unless they are strategically positioned, e.g., in a new growth market; or 2) improving availability (through improved manufacturing performance) for those that have high volume and profit; or 3) cost engineering those that have high volume, but low profit; or 4) assuring low inventories and just in time delivery for those that have high profit, but low volume, and so on.
Use a similar approach for comparing products and customers – for example, it’s common to have some 30% of customers represent 5% of the business volume. Considering how much effort is put into those 30% for the volume they represent, you may want to 1) increase prices to cover actual total costs; or 2) discourage or even drop those customers that do not represent your future and growth.
Improve Operations
When business is good, and many products are sold out, companies typically do not have enough time to improve their processes. When business is bad, companies typically do not have enough money to support improving their processes. It’s a common conundrum. Given the current situation, what can companies do to improve and prepare for their markets to improve, but not spend much money in doing so. Below are several suggestions, in the form of questions, along with data from various studies related to the questions. Addressing these issues does not cost a lot of money out-of-pocket, but it does require a disciplined process to address each, and it will save you money, and it will prepare you for markets as they improve. Take the time to address these issues, now that you have time.
1) Startup/Shutdown Procedures. Are your startup and shutdown procedures accurate and adequately detailed to assure excellence in this area? Are your operators trained in and disciplined in following the procedures? The highest risk of inducing defects and failures is during startup (and shutdown) - Some 67% of failures occur with the infant mortality pattern; You're 7-17 times more likely to induce defects during startup than during normal operation.
2) Product Changeovers. Do you have excellent changeover practices that minimize the risk of lost production, and of inducing quality problems and equipment defects? See the comment above on shutdown and startup. It's common that 20% or more of production losses are incurred during product changes. Using simple steps to review and improve changeover practices often result in reducing the amount of time required by 75% and more.
3) Shift Handover. Do you have excellent shift handover practices - detailed, procedures/ checklists that are reviewed at each handover? The greatest risk of having a major incident (safety and/or environmental) is shortly after shift handover, particularly after a major maintenance effort, or after a long absence of key personnel, or after a significant transient, or with big experience differences between shifts, or some combination.
4) Operator Care. Do you have excellence in operator care and minor PM, e.g., TLC or tighten, lubricate, clean? Several studies indicate that some 70% of equipment failures can be prevented by operators.
5) Process Conformance. Do you have good operating process conformance? That is, are your key process variables within process limits 99.4% (Four Sigma) of the time? If not, do you track your non-conformances, and their causes, and use this data in Pareto charts to improve conformance? Most processes are around 93% (Three Sigma) compliant.
6) PM Optimization. Are your PM's optimized? That is, do they help you avoid defects (oil and filter changes), or detect defects early enough to minimize their consequence (condition monitoring), and are they done at an interval that's not too often (wasted productivity), or not often enough (failure to detect in adequate time)? Some 20-30% of the PM's in a typical manufacturing plant can be eliminated.
7) Planning. Do you have one plan for the site which integrates the production and maintenance plan? Too often production has a plan and maintenance has a plan, but the plans are not integrated and aligned to the overall purpose of the business. It needs to be.
8) Safety. Do you have excellence in your safety performance? A reliable plant is a safe plant is a cost effective plant is an environmentally sound plant. Various studies indicate that the more disciplined you are about your operating practices (high OEE, high PM compliance, high schedule compliance), the fewer injuries you'll have, the lower your costs will be, the better your environmental compliance will be. I have the data. So, if you believe in better safety performance, you should be using this time to improve your operating practices. You'll be better for it.
9) Design/Capital Projects. Do you focus on lowest life cycle cost? Or lowest installed cost? Could you use this time to develop policies and procedures that better align manufacturing and capital projects for better long term results? Reliability in the operation begins with excellence in design.
Surviving in Difficult Times – Focus on Reliability and Defect Elimination
How do we survive these difficult times? As noted, you may have to do cost cutting to survive in the short term. The data overwhelmingly suggest this action will not provide for your long term success. It should be your last choice in any event. If you have a strong balance sheet and strong leadership, you can use this time to position your company to “buy or bury the competition”. If you must cut costs, then afterwards how will you be able to sustain your performance and position yourself for success and long term prosperity? There is a compelling case that a reliable plant is a safe plant is a cost effective plant is an environmentally sound plant.
Especially in these difficult times, it is essential that you get your reliability right. Your costs will be lower, you will survive, your people will be safer, and you will be environmentally friendly. Ultimately you will prosper. Let’s consider the data below, where measures of reliability include:
1) Overall Equipment Effectiveness (OEE), or Asset Utilization (AU), both of which measure the percent of ideal at which a plant is operating;
2) Reactive/Corrective Maintenance;
3) Preventive and Predictive Maintenance, and
4) Schedule Compliance – the discipline with which your execute your plans.
The data below are exemplary of a much broader set of data, not “one-of”, or “cherry-picked”. Correlation coefficients, R, are shown on each plot. The data support the basic premise is that if you’re reliable, you’ll be able to operate at very high levels; you won’t need to be very reactive; your systems will be stable and in control; and your costs, safety, and environmental performance will improve.
Figure 1 is from a large US manufacturing company over a five year period (10+ plants across the world, $7B in annual revenue). Have a look at the data and see what you think it suggests:

Figure 1 Production Capability (OEE) vs. Injury Rate
The data have been normalized, that is, a base number was selected and all the other numbers divided by the base number. The correlation coefficient, or R, is 80% for this data, a remarkable correlation for industrial data. It can easily be argued that when the plants are running well (high OEE), injuries are less likely. You’re not reacting to the most recent failure and risking injury, and its attendant higher costs and poorer overall performance.
Further, consider Figures 2 and 3 below from a large chemical plant over an eight year period. Each data point represents one year’s worth of injuries and the same year’s total work orders of the type indicated. Injuries per year are all injuries, including “first aid” ones. PM (preventive maintenance is time-based) and PdM (predictive maintenance is condition-based) represent work done in a planned fashion and relate to a specific time-based action (e.g., lubricate bearings monthly) or to an equipment condition action (e.g., detected a fault that requires a planned repair within the next month to minimize its consequence to cost and downtime). Corrective and reactive work orders are those done in a relatively unplanned or unexpected manner, e.g., equipment failed - repair as soon as possible.
Figure 2 Injuries vs. PM/PdM Work Orders per year
As the data in Figure 2 illustrates, the more PM/PdM work (in control), the fewer the injuries. My experience has also been that the higher percentage of PM/PdM work at a given plant, the lower the costs, and the higher the OEE or AU. Further evidence of this is provided in Figures 4-7, discussed below.
Next, consider Figure 3, which is data from the same plant during the same time period. Only this time, we’re measuring the number of corrective and reactive work orders in a given year and comparing it to the injuries that same year. It indicates that the more corrective and reactive work done, the higher the injury rate.
Figure 3 Injuries vs. Corrective and Reactive Work Orders per year
My experience has also been that the more reactive a given plant, the lower the OEE and the higher the costs. Reactive work is routinely reported to cost two to five times more than planned work. Again, further evidence of this is provided in Figures 4-7 below.
Figure 4 is data from some 180 manufacturing plants, mostly process industries, and indicates that the more reactive a plant is, the lower the OEE, and vice versa. And, since the total work must be 100%, the more PM and PdM work done, the higher the OEE. Anecdotal data from various discrete manufacturing plants indicates that there is a parallel line approximately 10% lower on the OEE scale of this figure. A reliable plant is typically more productive than a reactive plant.
Figure 4 OEE vs. Percent Reactive Maintenance
Moreover, a reliable plant is a more cost effective plant. Consider the data in Figure 5 from another large manufacturer with global operations.
Figure 5 Production Unit Costs vs. Reliability Index
In Figure 5, the reliability index is based on the composite score of some 600 data points at a given plant that reflect its practices and processes with regard to applying reliability principles. If you want sustainable lower costs, get your reliability processes right. If you simply cut costs, your results are not likely to be sustainable. You may see some immediate improvement over 6-12 months, but over subsequent years, there will be a price to be paid in poorer performance and higher costs. Also notice in Figure 5 that there are plants that have a relatively low reliability index, i.e., 53, and low production costs, i.e., 71, whereas another plant has an almost identical index of 52, but very high production costs of 119. Why? They have structural differences in their cost structure. For example, the plant with the higher production costs has much higher energy costs than its sister plant, as well as higher delivered costs for raw materials. So not withstanding their practices being comparable, one has very different costs than the other. These structural differences should be analyzed as part of the decision making processes and in judging the plant’s operating performance. One question to ask is given each plant’s energy, raw material, and labor costs, as well as its technology, what is the lowest reasonably achievable and sustainable cost for that plant?
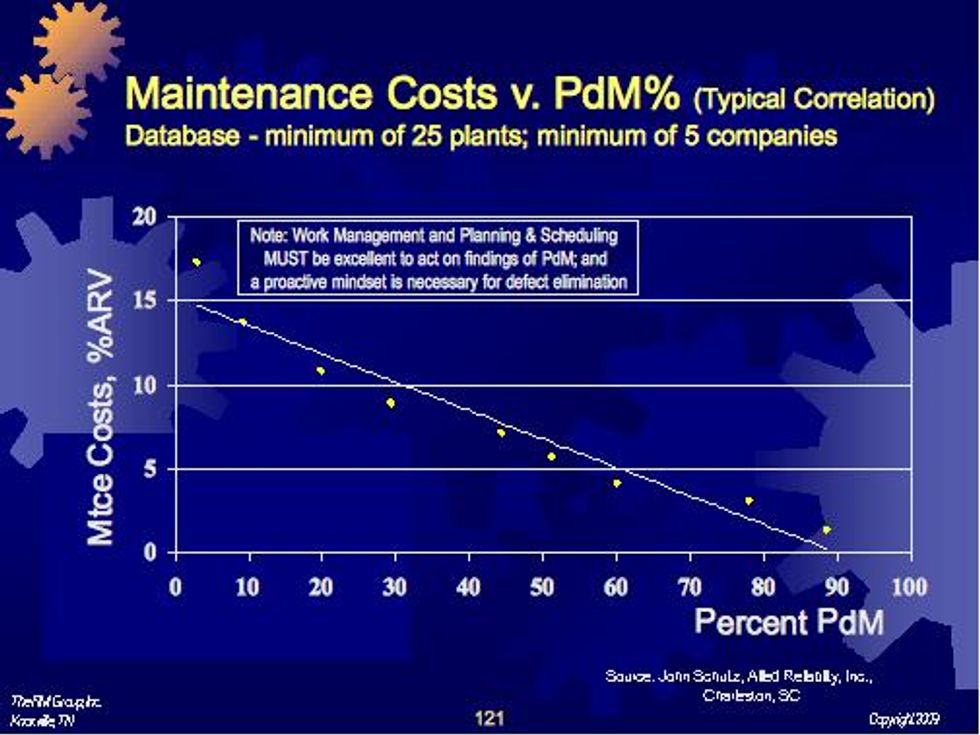
Regarding the use of PM and PdM (condition monitoring) work, consider Figure 6 below, where the level of Condition Monitoring/Predictive Maintenance is strongly correlated to lower maintenance costs.
Figure 6 Maintenance Costs v. Condition Monitoring
Maintenance costs are reported as a percent of asset replacement value (ARV). Percent CM/PdM is the percentage of the appropriate equipment that is being routinely monitored. Note that the data from any condition monitoring program must be comprehensively linked to excellence in work management and the planning and scheduling function; and a strong proactive approach must be used in eliminating the defects that caused the failures that were detected in the first place. The discipline necessary for work management and its relationship to making a safer work environment is also illustrated in Figure 7, below, which has data from five large manufacturing sites of yet another large global industrial manufacturer during a given year. It illustrates that as the discipline in the work practices improves, injuries are less likely to occur.
Figure 7 Injury Rate v. Maintenance Schedule Compliance
Finally, reliable plants tend to be more environmentally friendly or sound. Consider Figure 8 below, from a large chemical plant. It illustrates that when a plant is running well, you’re less likely to have environmental incidents.
Figure 8 Environmental Incidents vs. Asset Utilization
With all this said, it’s important to point out that the data have considerable variability. And that correlation is not cause and effect. However, you can infer cause and effect or a common cause to the different variables. Based on the above exemplary data, there is a strong case that can be made that a reliable plant is a safe plant is a cost effective plant is an environmentally sound plant. You can get improvement in safety by just focusing on safe work practices; in costs by just focusing on costs, and in environmental performance by just focusing on environmental issues. However, if you want all simultaneously, you must be reliable- you must do many things really well, being tenacious and disciplined in all your practices. The foundation of doing achieving all these goals is reliability.
Achieving Reliability
So, how do we achieve reliability? Focus on getting the processes right. Reliable plants maximize benefits – production capability, on-time delivery, quality, lower costs, higher gross profits (that in turn finance future investments in marketing, R&D, and new product and process development), and of course growth in customer satisfaction, market share, earnings per share and share price. And, reliable plants minimize risks – risk of injury, risk of production loss, risk of higher costs and risk of major incidents. Trying to sustain earnings per share in the short term by simple cost cutting will not likely serve you well in the long term. Indeed, it is more likely to put you at greater risk of future failures. Cost management through improved processes and defect and waste elimination is critical to your success. Consider the model in Figure 9, below.
Figure 9 The Reliability Process
We must eliminate the defects, and we must have discipline in our processes. Note where most defects occur that result in un-reliability, i.e., design, installation/startup, and operation. Further, in existing operations, we have less control over the first three functions – design, buy, and store, but we have much more control over the last three. If you’re starting with new plant or equipment, use concepts of life cycle cost, total cost of ownership, and running your storeroom “like a store”, a business, not an afterthought. But for most, the plant they have is the plant they have. So in the short term, they should focus on improved installation and startup (after major maintenance or project efforts, or changeovers) and shutdown practices, along with better operating practices. That’s where most of the defects are induced. As noted above, studies indicate that 1) you’re 7-17 more likely to induce defects (and environmental and safety problems) during startup than you are during normal operation; and 2) that some 67% of failures occur in the infant mortality mode, wherein the greatest risk of failure is during the first 30 days or so after startup. Moreover, data from the Japanese Institute of Plant Management and other studies indicate that some 70% of defects that result in equipment and process failures are induced by poor operating practices, e.g., poor startup and shutdown, poor operation, inconsistent operation across shifts, poor changeover practices, etc. And, if you want lower operating and maintenance costs – start by eliminating the defects in operations that result in production losses and maintenance requirements; and assure a comprehensive maintenance planning and scheduling process, one driven by condition monitoring and defect elimination. Conversely, if you remove resources from your business system (layoffs and budget cuts) before getting the right processes in place and eliminating the defects, you will be at much greater risk of not being able to perform to market expectations when the markets do bounce back. You will have “wrung out the costs”, but you will also have wrung out the capability to perform to market expectations.
Leadership, Alignment, and Change
Supporting this model requires leadership, alignment and almost always, cultural change. My view of leadership is that it’s the ability to inspire ordinary people to consistently perform at an extraordinary level, that is, to help them look forward to coming to work, every day. How? Put them into a business system that engages and aligns their personal interest with corporate interests. Give them work they like to do; challenge them to improve it; give them the tools to improve it; put them on an improvement team; teach them problem solving methods; when they do a good job, thank them and show your appreciation; send them to training, but when they return, make sure they use the training received. In other words, engage them. According to one study, engaged employees are three times more productive than average. According to another, eliminating the small day to day problems has a much bigger impact on performance than focusing on the major problems- think of hundreds of people routinely engaged in process improvement and defect elimination – think about what happens to costs, to performance.
Alignment requires the repeated articulation of a strategy, set of goals and respective roles from the CEO to the shop floor, along with measures and systems that reinforce the strategy, goals, and roles. It is really hard work. According to the studies, most organizations are not very well aligned. Most functions within a given organization operate within their silo, optimizing at the suboptimal level. Having everyone think at a systems level as to the impact their decisions will have on the business as a whole, and aligned to a common corporate strategy, not just their department’s, is essential.
Finally, regarding cultural change, when asked “Do people want to change?” Most people will reply something to the effect of “No, they do not; they’re stuck in their old ways.” I disagree with this view. I strongly believe that people do want to change, if given good reason to change, if there’s something in it for them (less hassle, more secure future, etc.), and if they participate in creating the changes (and thus have ownership for them). It’s up to the leadership of the organization to align the organization and facilitate change by applying these principles; and, to use this difficult economic time as a compelling reason, as a point of departure, for change.
Closing
The US federal government is currently attempting to spend its way to prosperity. And, as we’ve discussed above, during these very difficult times, many companies are doing the reverse, attempting to cost cut their way to prosperity. Both may be necessary, but neither is likely to work long term. The federal debt is now some $10 trillion, a truly unimaginable number. And, I have great concern about how that will affect our future, and that of my children and grandchildren. Not withstanding that concern, don’t let what you can’t do, e.g., manage the federal budget, stop you from doing what you can do, e.g., improve your operating practices. What can you do at the microeconomic level to get the right processes in place, engaging all your people in process improvement and defect elimination, so that you survive the current downturn, and come out of the downturn in a position to “buy or bury your competition”?
Ron Moore is Managing Partner of The RM Group, Inc. in Knoxville, TN. Ron is the author of Making Common Sense Common Practice: Models for Manufacturing Excellence, now in its 3rd Edition; and of Selecting the Right Manufacturing Improvement Tools: What Tool? When? He also leads a series of educational web workshops. He can be reached at 865-675-7647 or by Email at RonsRMGp@aol.com