Studies by F. Stanley Nowlan and Howard F. Heap ultimately resulted in the creation of reliability-centered maintenance (RCM), which contains six charts, three now commonly labeled age-related failure curves and three commonly labeled random failure curves. These are provided in Figures 1 and 2 and contain the original data, along with data from other subsequent studies analyzing these failure patterns and the percent of equipment exhibiting these patterns. This article examines these charts, with a particular focus to the random curves. It offers observations on these, along with suggestions for developing a strategy for avoiding failures and managing impending failures.

Figure 1: Conditional probability of failure – age related
Figure 2: Conditional probability of failure – random
First, these curves should not be considered as age related or random. They are all charts that reflect the conditional probability of failure and are all on some sort of timeline, so lumping them into those two categories may not be appropriate. For example, the random charts include the so-called infant mortality curve, which also makes up part of the bathtub curve, and it does indicate a higher risk of early life failure on a time line. Moreover, conditional probability of failure is constant for some period of time in five of the six curves and represents some 83 to 97 percent of the total equipment covered in the studies, depending on which study you select. A constant conditional probability of failure means that the probability of failure of any given machine in a set is equal to the probability of the failure of any other machine. More simply, it’s a random failure pattern, as shown in Figure 3. Any comments to the contrary are welcomed.
The conditional probability of failure curves can be confusing relative to how they are applied to the development of the correct maintenance strategy for a specific part or component. The human element could play a big difference in how a part or component fails. As an example, if you misalign a bearing, it increases the load and the bearing could appear to be a pattern C failure. If you forget to lubricate, it will appear to be a pattern F failure. As such, the distributions represent how a component will fail if it is properly designed, installed and maintained.
It is important to first determine whether a component has a wear-based or random-based failure mode. Is corrosion, erosion, or abrasion present, or are you witnessing a random event that could happen at any time? As you understand the specific components and failure modes, you begin to understand why, for example, some hydraulic and pneumatic components fit pattern E and others fit F. Ask, what is the difference between patterns E and F? Is it always human error that makes a component fit pattern F?
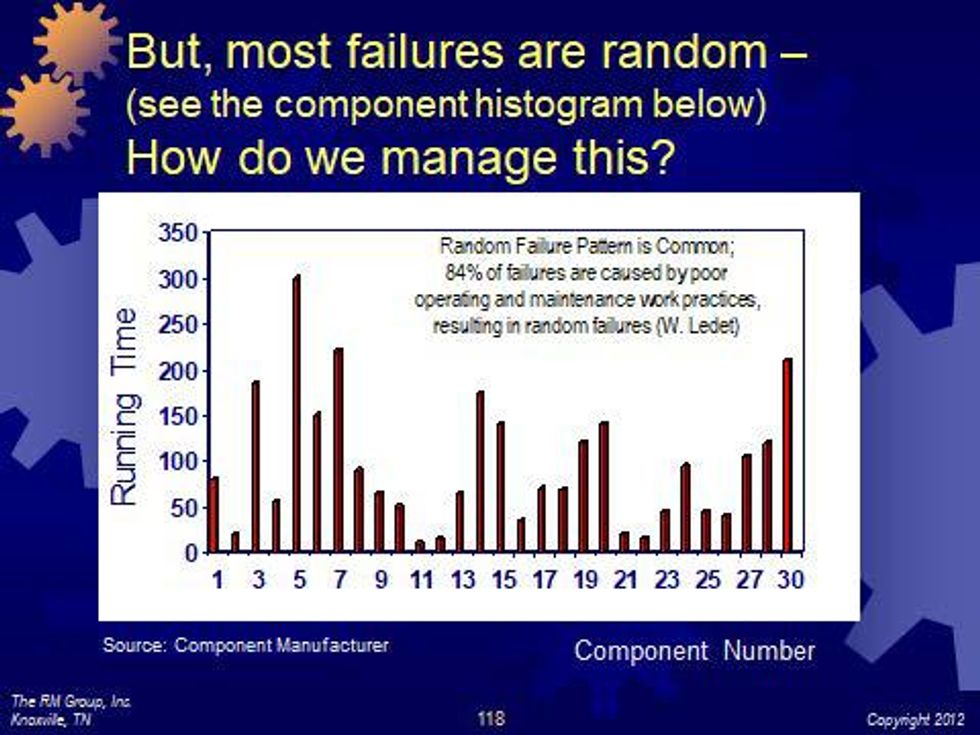
Figure 3: Random failure pattern in 30 identical components
It also should be pointed out that not everyone is familiar with some of the databases underlying these charts, while perhaps others have a much better handle on the data and any other analysis, for example, Weibull analysis, that might shed more light on them. Even using Weibull analysis, it may be a hard slog.
With all that in mind, the impressions from these charts are as follows:
- The highest risk of failure is during the infant mortality period. As such, design, fabrication, installation and start-up practices are the first order of business, e.g., designing and procuring for ease of operation and maintenance, including robust component selection; fabricating and installing with craftsmanship and precision to a very high standard; and start-up using detailed and precise start-up procedures. All of this requires a high degree of training, development, experience, and resulting skill. Without that skill, far more defects and failures are induced than otherwise would be.
- The random pattern applies to some 90% of the charts, so excellence in condition monitoring linked to actionable plans is critical. The approach to condition monitoring will depend on the failure modes associated with the equipment – selecting the technique or technology most applicable for detecting it, the frequency of those failures, and the consequence of the failure. A general rule to follow is that the rate of deterioration, combined with the severity of condition and the consequence of failure, will provide guidance for applying your judgment to the priority for action. So, the greater the rate of deterioration, the greater the severity of condition, the greater the consequence of failure, the greater the priority for action. Also, recognize that operators and inspectors must be part of any condition monitoring program since there are more of them and they can detect about as many defects as traditional predictive maintenance tools. The ability for humans to detect defects/failure comes much later in the P-F interval, but operator inspections/rounds are a must and should be done in combination with condition monitoring tasks.
- Time-based intrusive maintenance doesn't apply very often and, in fact, if arbitrarily applied, increases the risk of infant mortality defects and failures by doing unnecessary tasks. It will also increase your maintenance costs. You should only do it when you have data to validate your activity, and only with skilled personnel.
- The time frames are not explicit on any of the charts observed, so they likely vary with the type of equipment, its application and its failure modes. For example, the infant mortality period for a bearing might be 30 days, but for a transformer, maybe one year, or for an electronic instrument, one day. Although there might not be data or the analytical skills to assess these, they should be taken into account, if possible. These distributions are a model, but without a specific timeline for each. For example, if you fail to lubricate a high speed bearing, how long will it take to seize? What if it’s a low speed bearing? One could be minutes, the other months, but regardless, both bearings failed well before they should have. Both are infant mortality.
People working on airplanes or making cars, chemicals, paper, pharmaceuticals, etc., might ask: How does this apply to us? The truth is, most industries have pumps, valves, switches, relays, motors, couplings, actuators, electronic components, pneumatic components, hydraulic components and mechanical components. The only difference between most industrial companies and the airline industry is that the airline industry is forced to change. The safety of its customers force that change (that and the impending cost of lawsuits if it didn’t change) and, as a result, the industry looks very closely at how it should maintain its assets. The truth is, unless the loss of human life is a potential consequence, your company will always look for the business case for RCM and if you fail to select the correct piece of equipment, fail to implement the results, fail to perform the tasks, or fail to quantify the results, RCM will quickly go away for a few years.
In the end, when it comes to conditional probability of failure distributions, the objective of RCM is to reinforce three things:
- Preventive maintenance (PM) will only work on wear-based components and only if they have been properly installed and maintained;
- Condition monitoring (i.e., condition-based monitoring (CBM), predictive maintenance (PdM), operator rounds) will detect defects on components that have a useful P-F interval;
- Human error is responsible for the vast majority of random-based failures. Therefore, the goal of your RCM should be to identify these shortcomings and eliminate these failures through training, certification and well-written job plans.
When developing your reliability strategy, if you don’t train and develop your people with the proper skills and have the proper procedures, none of this will work for you. Engaging your people in problem resolution is paramount.
Editor’s Note: The authors welcome comments from others to make these observations more meaningful and/or accurate, and therefore more useful.
From Your Site Articles
Related Articles Around the Web