Back in the June/July 2006 issue of
Uptime, I authored an article entitled Expanding the Curve detailing why the traditional P-F curve was incomplete. While it was expected that the article might elicit both positive and negative comments, it came as a surprise how strong some of those opinions were.
The immediate comments were all positive. They came from a variety of people, most working in roles, such as maintenance supervisors, maintenance technicians and reliability engineers. Also commenting were three highly respected reliability consultants, one of whom asked why Point D was left out of the article. This consultant stated: “I am curious to know, in the article, after covering the importance of precision maintenance, you went on to discuss the importance of using a number of reliability tools and methods in the design phase. Shouldn’t there be a Point D as well?”
A Google search of the term in 2010 returned over 30 different versions of the P-F curve
Yes, in fact, the article and its illustrations should have denoted a D-I-P-F curve.
The negative comments came in a more indirect fashion. In public discussions on social media, several reliability-centered maintenance (RCM) practitioners commented on a somewhat regular basis: “When someone believes the P-F curve needs to be expanded, it’s a clear indication that they truly don’t understand the intent of the P-F curve.” Attempting to explain the concept drew more personal criticism.
Over the next decade, different versions of the D-I-P-F curve presented by other people appeared in magazine articles, conference presentations and company conference rooms. Though the concepts behind these creations were being understood and taking hold, not a single illustration referenced the July 2006
Uptime article, which introduced this concept.
That all changed in 2017, when Terrence O’Hanlon, CEO of Reliabilityweb.com and Publisher of
Uptime magazine, was working on creating some illustrations of various reliability concepts that included the complete P-F curve. However, he pointed out, “I’ve noticed there are versions of this floating around and not one of them credits you for developing this concept and that needs to be corrected.” He added, “Not only that, I would like to copresent this concept with you as the keynote address for IMC-2017.”
Needless to say, it was an honor to do so.
The History of the P-F Curve
The concept of the original P-F curve was first introduced by Stan Nowlan and Howard Heap as part of their 1978 document titled,
Reliability-Centered Maintenance. Using an on-condition task of a visual crack as the measure of metal fatigue, they explained the diagram as Point A being new and the crack first appearing as Point B. At this point, the crack can be monitored until Point C, which they defined as potential failure, later to be known as Point P. Point D in their sketch is defined as functional failure, later to be known as Point F. This is the point at which the item should be repaired or replaced. Additionally, ΔT represents the interval of the on-condition inspection.
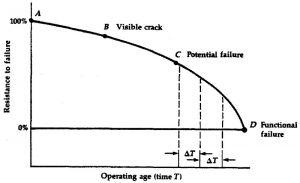
 Figure 1: Nowlan’s and Heap’s original P-F curve
If you’re a bit confused at this point, you should be. In the 1970s, on-condition maintenance in the industrial world had yet to be associated with the technologies known today.
John Moubray, the creator of RCM2, cleared this confusion up in a big way with the release of his book,
RCM II Reliability-Centered Maintenance. His section on the P-F curve did well to explain the association between the P-F curve and the ever-growing list of technologies available to help detect Point P for a given failure mode.
After reading Nowlan’s and Heap’s document and Moubray’s book, you should have a pretty good understanding of the P-F curve and how you should be applying it to determine applicable and effective tasks to mitigate the failure modes you are experiencing with your equipment.
But that doesn’t always happen. A Google search of the term in 2010 returned over 30 different versions of the P-F curve. While all may be well-meaning, most completely missed the mark, adding more confusion to something that should be straightforward.
Understanding the D-I-P-F Curve
The idea to add to the P-F curve was driven by customers. One specific customer was struggling with a relatively new predictive maintenance (PdM) program. The organization had been applying vibration analysis to over 800 assets for three years. While it was somewhat pleased that Point P could be detected so it could plan, schedule and replace items before they failed, there was frustration from the fact that three months later, the asset would once again be in alarm.
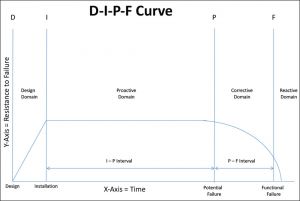
 Figure 2: The first draft of the D-I-P-F curve, also known as the asset lifecycle curve, created for RCM Blitz® training materials in July 2006. (D. Plucknette, Reliability Solutions Inc.)
The first RCM analysis revealed why this organization was struggling. While its PdM services company was outstanding at detecting Point P, the report offered little to no explanation as to the cause of the increased vibration, other than to say it was misalignment or looseness. Until the failure modes causing these alarms were identified and mitigated, they would continue to come back.
The RCM analysis identified over 140 failure modes, including:
- Misalignment;
- Soft foot;
- Pipe stress;
- Lack of lubrication;
- Cracked foundation;
- Improper belt tension;
- Improper design/application.
The failure modes on the list covered in the organization’s first RCM had one thing in common – each one could be eliminated through either a simple redesign or good maintenance practices.
While a large percentage of reliability efforts are focused on detecting Point P, the truth is, if organizations simply did the right things, Point P would very seldom rear its ugly head!
Changing Direction Starts With Design
The first thing to always consider in terms of an asset’s lifecycle is the inherent reliability you expect the system, asset, component, or item to deliver. Inherent reliability is the level of reliability the item will deliver when protected by a complete maintenance strategy that includes on-condition and preventive maintenance (PM) tasks. This being stated, all the maintenance in the world will not improve the reliability of a system, asset, or component whose inherent reliability is poor.
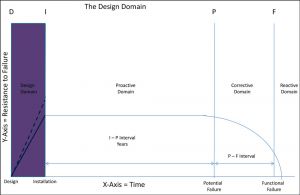
 Figure 3: The design domain portion of the D-I-P-F curve where an asset’s inherent reliability is determined; dotted line represents the understanding of designing for a level of reliability beyond performance expectations. (D. Plucknette, Reliability Solutions Inc.)
Now on to Point D and the design domain of the D-I-P-F curve. As part of Point D, you should take a close look at your capital improvement process to ensure it uses a combination of tools that work together to achieve a strong or robust inherent reliability. This includes, but is not limited to:
- RCM Blitz®;
- Failure mode and effects analysis (FMEA);
- Reliability block diagrams;
- Select supplier agreements;
- Requirements documents;
- Design standards;
- Equipment hierarchy;
- Criticality analysis.
Moving On to Installation
While it can’t be stressed enough the importance of using reliability tools and techniques in the design phase of the D-I-P-F curve, Point I, for the installation domain, is where the rubber meets the road. The most reliable design can be ruined forever by poorly executed installation. Unfortunately, it is not uncommon with a brand-new installation to find mixing of metals on the same piping service, unsupported piping, loose or missing guarding, poorly wired panels and undersized foundations.
At a time when company managers are dreaming about the benefits of the Industrial Internet of Things (IIoT), how is it they are still ruining perfectly good designs by totally messing up the installation?
Of 10 companies assessed in 2017:
- Eight had no formal installation standards when it came to their capital improvement program;
- Nine did not include mechanical, electrical, or instrument tradespeople as part of their capital improvement team;
- Therefore, nine did not have their maintenance tradespeople performing quality checks on the work performed by installation contractors;
- Zero knew if the installation contractor’s tradespeople had completed formal skilled trades training.
They also had no idea, when asked, if the contractors could perform precision alignment, had the reference tables and ability to look up various bolt pattern and torque specifications for flange assembly, or had the proper certifications for installing explosion-proof wiring systems.
These dismal facts only will improve when your company recognizes these gaps and makes the decision to include asset reliability as part of its capital planning process. Companies also need to make sure their people are trained in the use of precision tools and the importance of following detailed installation standards. If you spent the time and used the methods and tools to ensure a good design, then make sure you cash in on those improvements with a great installation.
The additional cost of adding reliability tools and methods into your capital improvement process is one to three percent at best. It’s a small price when compared to what you will gain in the very near future.
The Proactive Domain
The proactive domain is where organizations recognize their return on investment for adding reliability tools, methods and resources to the capital improvement process. It is in this domain where you apply the proactive equipment maintenance plan developed through the application of tools, like RCM Blitz
®, from the design phase of the D-I-P-F curve. This list of tasks includes continuous on-condition monitoring (IIoT), PdM inspections, PM inspections, operator care tasks, lubrication tasks and failure finding tasks.

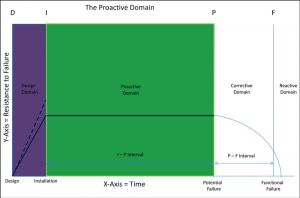
Figure 4: Proactive domain of D-I-P-F curve is where proactive equipment maintenance tasks are performed on a set schedule to ensure maximum I-P interval. (D. Plucknette, Reliability Solutions Inc.)
The completion of these tasks at their scheduled intervals ensures the longest I-P interval possible. Failure to identify the tasks, complete the tasks, or poor installation practices drastically reduce the I-P interval.
Sadly, a large percentage of companies are experiencing drastically reduced I-P intervals because they fail to recognize the importance of installation standards when replacing failed components and they fail to complete their proactive tasks at their prescribed intervals.
While this might sound bad, it can get worse. Many companies try to fight this battle by living further right on the curve. The farther to the right you go, the more out of control and costly maintenance becomes.
Defining Point P
Nowlan and Heap defined potential failure (Point-P) as: “An identifiable physical condition which indicates that a functional failure is imminent.” This physical condition can be detected in many ways, including on-condition tasks (PdM), human senses and process verification/IIoT.
Some important things to understand about Point P:
- Point P is NOT where the failure occurred; it is where it is first detected. Bearings don’t suddenly start to vibrate or get noisy and hot, something causes those physical conditions to occur. This cause is the failure mode.
- In many cases, Point P can be eliminated. If you can identify the failure mode that resulted in an identifiable physical condition, you can usually eliminate that failure mode with good installation and maintenance practices.
- Point P can and will move up and down the P-F curve, depending on the task being used to identify the presence of a physical condition. The best task for identifying Point P is one that is both cost-effective and consistent in early detection of Point P.
- It is not uncommon to use multiple tasks and multiple physical conditions to ensure Point P is detected.
- Point P does NOT come with a known time limit. To be clear, once Point P is detected, the time it takes for the item to become functionally failed is unknown. What you do know is that once Point P has been detected, failure is imminent and will not be avoided without intervention.
The Corrective Domain
Also known as the P-F interval, the objective of the corrective domain is to plan and schedule repair or replacement of the item detected by Point P before a functional failure occurs.

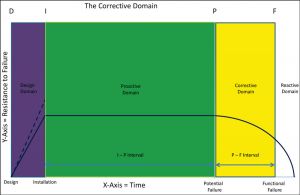
Figure 5: The corrective domain is where you plan, schedule and execute repair or replacement of items Point P has detected. (D. Plucknette, Reliability Solutions Inc.)
Important things to understand about the P-F interval:
- Every component and part at your plant fits the P-F curve. The difference from one component or part to the next is the time it takes to go from Point P to Point F. Depending on the component, part and failure mode, the P-F interval could be months or a fraction of a second.
- The P-F interval is critical in helping you make sound on-condition task decisions. Component/part and failure mode must have a useful P-F interval and be cost-effective for an on-condition task to be considered applicable and effective.
- The interval for an on-condition task should be one half of the P-F interval or less to ensure the identifiable physical condition is always detected.
While some companies accelerate the frequency of their on-condition tasks, once Point P has been detected, this practice often leads to destructive behaviors and does nothing more than increase the cost of failure. Once you have detected Point P, you should immediately plan and schedule the repair or replacement of the item as soon as possible. As pointed out earlier, once Point P has been detected, failure is always imminent. Additional testing only brings a false sense of security while, at the same time, casting doubt on the technologies used to detect Point P. If you want the technologies to have a sustained presence in your maintenance organization, you have to have the discipline to believe in them and replace the item as scheduled.
Point F
Point F on the D-I-P-F curve designates the point at which the item becomes functionally failed. Nowlan and Heap defined functional failure as: “The failure of an item to perform its normal or characteristic actions within specified limits.” The understanding of what functional failure means to your equipment is critical in the successful application of on-condition maintenance. Point F is where many people become confused with the P-F curve, as evidenced by several illustrated versions available on the Internet that show total failure or an explosion graphic as Point F, which could cause confusion between functional failure and catastrophic failure.
In simple terms, Point F or functional failure is the point at which your component is no longer able to function at a specified performance standard. As an example, if you expect a centrifugal pump to supply a liquid at 120 gallons per minute (GPM), it is functionally failed when it can no longer produce 120 GPM. It will still operate, it will still produce pressure and flow, but if you need 120 GPM and its only producing 119 GPM, it has functionally failed. Why is this important?
Understanding performance standards, functions and functional failures is what enables you to continue to supply your customers on a regular basis. Understanding functional failure is not only part of that, but it also helps you drastically reduce secondary damage to your equipment. If you can muster the discipline to replace or repair your equipment prior to functional failure, there should be little to no secondary damage AND you still should be able to supply your customers’ orders.
The Reactive Domain
The most costly and dangerous place for a company to perform the majority of its maintenance work is in the reactive domain. Ten years ago, it wasn’t all that uncommon to find companies whose maintenance workload was 70 percent reactive or more. While most have learned this lesson, there are still companies living this nightmare. Within one hour of walking in the door, the ugly signs of an organization in chaos begin to show up. There is a daily punch list in the maintenance supervisor’s office; maintenance spending on spare parts is over budget; scheduled proactive events are often postponed; overtime is out of control; there is a high occupational safety and health administration (OSHA) reportable rate; and so on.

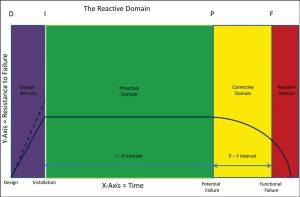
Figure 6: The reactive domain, by far the most expensive domain in which to perform maintenance because secondary equipment and component damage has already occurred, multiplying the cost of repair more than five times compared to completing it in corrective domain. (D. Plucknette, Reliability Solutions Inc.)
It has been documented that companies performing the majority of their maintenance in the reactive domain can expect a transition time of five to 10 years to become an organization that considers maintenance reliability a part of their capital improvement process.
If your organization is presently living in this domain, the question you should be asking yourself is: Will this company continue to survive another five or 10 years?
Conclusion
In the last 10 years, acceptance of the D-I-P-F curve has grown to a point where it is often referenced in articles on asset management and reliability engineering. Companies looking to manage the entire lifecycle of their assets can benefit from the tools and methods that can be used at each point of the curve.
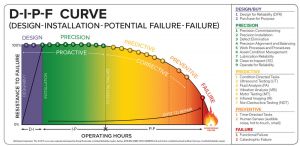
 Figure 7: D-I-P-F curve as created by Reliabilityweb.com. Copyright 2016-2018. NetexpressUSA Inc. d/b/a Reliabilityweb.com. (Download this PDF: www.reliabilityweb.com/steal-these-graphics)
References
- Nowlan, F. Stanley and Heap, Howard. Reliability-Centered Maintenance. San Francisco: United Airlines, December 1978.
- Moubray, John. RCM II Reliability-Centered Maintenance. Norwalk: Industrial Press, Inc., 1997.
- Plucknette, Douglas. Reliability-Centered Maintenance Using RCM Blitz™. Fort Myers: Reliabilityweb.com, 2009.
- Plucknette, Douglas. “Expanding the Curve.” Uptime magazine. June/July 2006.


