The S-D-I-P-F Safety Reliability Curve Begins With the 1979 Birth of the P to F Interval.

“Determining the interval for on-condition inspection of an item subject to metal fatigue. Once the rate of decline in failure resistance has been determined, an inspection interval “ΔT” is established that provides ample opportunity to detect a potential [P] failure before a functional [F] failure can occur.” Excerpt from: F.S. Nowlan, “Reliability-Centered Maintenance,” 1979.
Over 40 years later, many of the benefits from Stanley Nowlan’s and Howard Heap’s Reliability-Centered Maintenance report are still setting the standard for achieving asset reliability.
Setting inspection periodicities based on failure mechanisms and failure modes is a basic maintenance building block for high reliability organizations. The approach described in the P-F curve is proven and forms the center of what many refer to as predictive maintenance, however, the Uptime® Elements A Reliability Framework and Asset Management System™ refers to it as asset condition management (ACM). The basic concept is to use sensors to detect a defect prior to it causing a functional failure. The repair or renewal can be scheduled prior to more severe damage and we have a longer scheduling envelope to avoid interrupting production or operations.
As solid as the original P to F curve is, it is applied in the final stages of an asset’s lifecycle and does not attempt a whole life asset view.
Various stakeholders, who can obtain or remove value from assets at various stages of their life and their roles in the organization, typically work in silos. A critical success factor for assuring value from assets is to better understand the dynamic connections between reliability strategy development and asset criticality and risk management and decision-making and asset condition management and preventive maintenance and work execution management and asset knowledge and asset management across the assets’ lifecycles and based in policy, strategy and plan to align intentional thought, effective action and efficient effort toward creating value from assets aligned toward achievement of organizational objectives.
That alignment and energy must be intentional for a group to achieve a new future that was not going to happen anyway.
 Figure 2: The Uptime® Elements, A Reliability Framework and Asset Management System (Terrence O’Hanlon, Reliabilityweb.com)Terrence O'Hanlon, Reliabilityweb.com
Asset management, as described by the Uptime® Elements A Reliability Framework and Asset Management System, creates an intentional management system or, more specifically, an asset management system to ensure opportunity and risk are managed or treated at the asset level that is appropriate for achieving organizational objectives as set by top management through value generated by the assets.
The Time Machine
 Figure 3: There is nothing in a caterpillar that tells you it’s going to be a butterfly - Buckminster Fuller
One of the challenges with reliability is that its effects and causes are disconnected in time. Reliability decisions pay significant dividends, but they are paid slowly, over long periods of time. With management typically focused on short-term projects and goals, it is easy for organizations to depreciate reliability and realize a loss of consistent value generation from assets in a much more rapid fashion than it took to gain it.
 Figure 4: The S-D-I-P-F Safety Reliability CurveTerrence O'Hanlon
 Figure 5: What is RAMS2F by Terrence O’Hanlon
The fallacy of improving reliability through maintenance has been chased for the past 40 years and like Sisyphus pushing his rock up the hill, a few dedicated teams of driven people make it to the top through a noble hero’s journey, but the rock inevitably rolls back down again within two to three years. The best practice maintenance expert advice sends the team to the planned domain where they develop systems to anticipate and deal with failures through efficient maintenance processes. The only problem with this approach is that maintenance cannot influence all the causes of breakdowns. The planned domain is unstable and quickly becomes a reactive-planned domain, with an almost inescapable gravitational pull of failures caused by defects beyond the control or influence of the maintenance department to remove them or inspect and monitor to detect them.
The S-D-I-P-F Safety Reliability Curve is a visualization that attempts to graphically “bend time” to amplify the benefit of investing in and applying early reliability and sustainability efforts by showing a lifetime snapshot of the asset over time.
All due respect is given to Stanley Nowlan and Howard Heap, however, their excellent P-F curve work was intended strictly as an on-condition monitoring periodicity determinant. It is with high respect that their work is used in creating the
S-D-I-P-F curve.
Some of the ideas expressed in the S-D-I-P-F curve:
- It visually expresses the full asset lifecycle phases from a “ x for Reliability” lens.
- It visually expresses the leverage or influence level or opportunity sets for improving reliability and availability over the asset’s lifecycle phases.
- It visually expresses total cost of ownership with and without formal asset management.
- It visually expresses the greatest opportunity sets for reliability, sustainability and maintainability to improve the asset itself early on in the asset’s lifecycle phases.
- It expresses respect for the original intent of the P-F curve as a method to determine asset condition monitoring periodicity.
- It visually expresses operating maturity domains and encourages moving to the precision and expansive domains.
What ideas do you see? Make note of them.
 Figure 6: RAMS2F by Terrence O’Hanlon
 Figure 7: Maintainability should be considered during design to leverage total cost of ownership
 Figure 8: The target to achieve is an engaged, empowered, cross-functional culture of reliability
 Figure 9: Sources of defects
Some RAMS2F Embedded in S-D-I-P-F Curve
Some of the more technical aspects of the RAMS2F asset lifecycle theory are embedded in the S-D-I-P-F curve:
AVAILABILITY is defined as the probability that the system is operating properly when it is requested for use.
RELIABILITY is the probability that a system or asset will operate in a satisfactory manner for a specified manner for a specified period of time when used under stated conditions.
Both reliability and availability can be specified, predicted and measured. The biggest opportunities to improve them exist during the early asset lifecycle phases of specification, design, procurement, build/create, and install/commission. Once in operation, the opportunity sets to improve the inherent reliability is limited.
MAINTAINABILITY is defined as the probability that a failed system will be restored or repaired to a specified condition within a period of time when maintenance is performed in accordance with prescribed procedures.
Maintainability can be specified, predicted and measured. The biggest opportunities to improve it is through planning and execution.
Maintenance includes all scheduled and unscheduled actions necessary for retaining an item or restoring it to an operational condition. Maintenance includes repair, replace, remove, restore, renew, testing, modification, inspection, servicing calibration, overhaul, condition verification, and so on. Maintenance may or may not result in downtime. Maintenance is usually a major contributor to lifecycle cost.
Some Cultural Aspects Embedded in the S-D-I-P-F Curve
The target to achieve is the expansive opportunity domain through the precision domain by creating an engaged, empowered, cross-functional reliability leadership culture.
Traditionally, the maintenance team owns breakdowns or unreliability. They are the specialists with the know-how to react quickly to get the assets back online. They repair, replace, renew, restore and inspect.
Unfortunately, many organizations also default responsibility for reliability to the maintenance teams without providing all the controlling influences, setting up a cycle of unplanned breakdowns that often lead to a safety, environmental, or economic catastrophe.
Engineering, Procurement, Operations, Quality, HR/HCM, Training, Safety, Stores, Capital Projects, IT, Sales, Marketing and top management are all stakeholders in reliability and make decisions that enable and disable reliability. A coordination effort, guided by policy, strategy and plan, is required to ensure intentional value.
Getting these stakeholders engaged is what the Uptime Elements A Reliability Framework and Asset Management System is all about. The S-D-I-P-F curve is designed to help you tell the story that you need to tell to engage those stakeholders who can enable your reliability journey! Please let the Reliabilityweb.com team know how they can support that.
The S-D-I-P-F curve is created as part of the Uptime Elements A Reliability Framework and Asset Management System by Terrence O’Hanlon. He is open to hearing your ideas around the S-D-I-P-F Safety Reliability Curve.
From Your Site Articles
Related Articles Around the Web


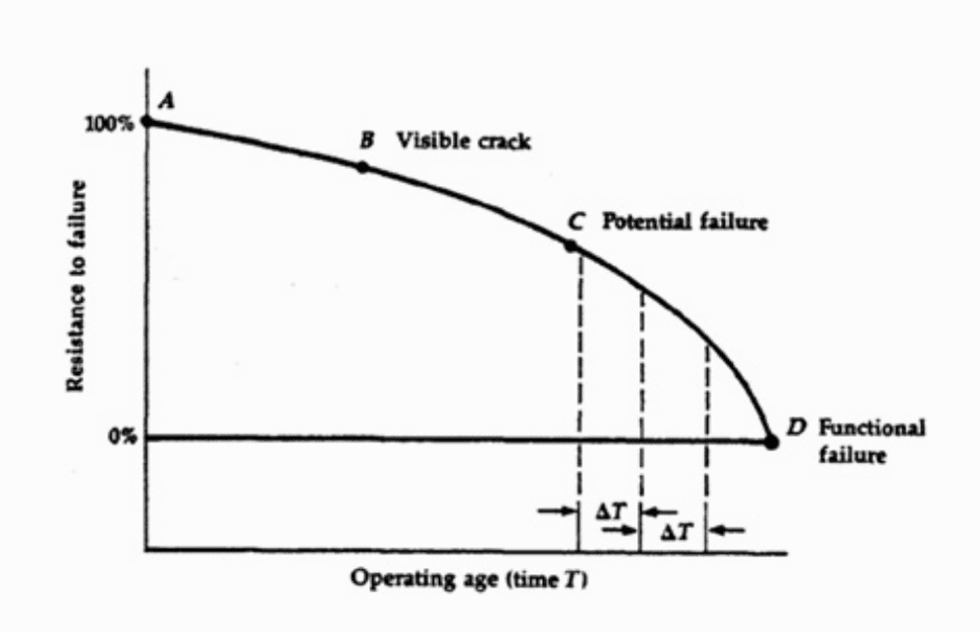
 Figure 2: The Uptime® Elements, A Reliability Framework and Asset Management System (Terrence O’Hanlon, Reliabilityweb.com)Terrence O'Hanlon, Reliabilityweb.com
 Figure 3: There is nothing in a caterpillar that tells you it’s going to be a butterfly - Buckminster Fuller
  Figure 4: The S-D-I-P-F Safety Reliability CurveTerrence O'Hanlon
 Figure 5: What is RAMS2F by Terrence O’Hanlon
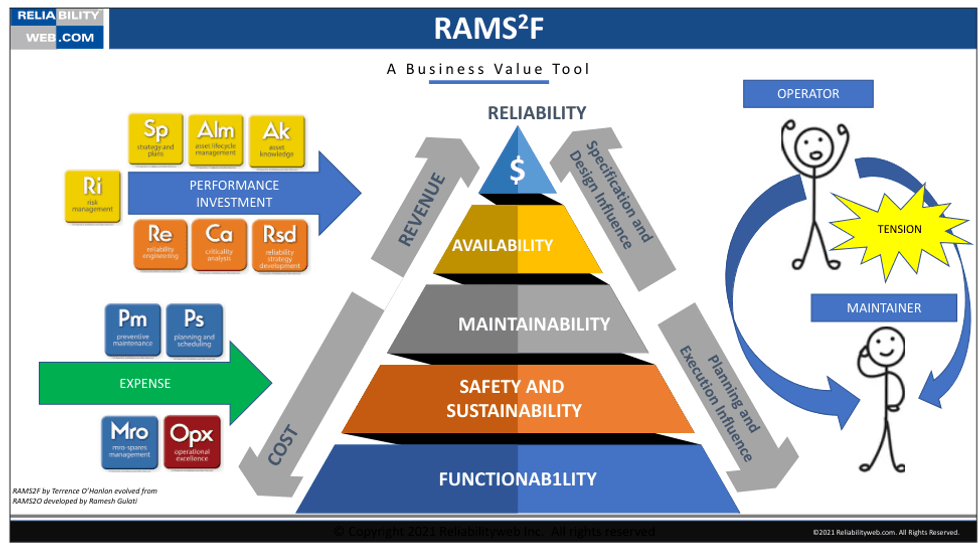 Figure 6: RAMS2F by Terrence O’Hanlon
 Figure 7: Maintainability should be considered during design to leverage total cost of ownership
 Figure 8: The target to achieve is an engaged, empowered, cross-functional culture of reliability
 Figure 9: Sources of defects