Originally, the intent of fault tree analysis (FTA) was to assess equipment reliability in the space industry. Nowadays, FTA is being widely used in any type of study that requires quantifying frequency or probability, or just for deductive representation of events that, when triggered, result in an occurrence of a top event. This article summarizes FTA quantification using the method of cut sets (MOCUS) and describes the methods of Birnbaum, criticality and Fussell-Vesely.
Background
FTA can be developed as far down as the analyst requires. The analyst must have a logical mind and the ability to understand and visualize the logic structure and the interactions of operability, chemical, electrical, mechanical, structural, control systems, subsystems, etc. It is also essential to know the client’s desire to perform an FTA, without falling into the trap of providing an excessive amount of details, which can be useless for the client.

Figure 1: Simple FTA example
The FTA should take the exact level of detail needed, which is normally the equipment level. The internal design of a piece of equipment has a very low chance of redesign and requires specific expertise to assess internal components. Therefore, exploring detailed components may not always be the best approach, especially during the initial engineering stages. Figure 1 shows a simple example of a general FTA and its Boolean equation.
According to the American Institute of Chemical Engineers Center for Chemical Process Safety (AIChE/CCPS), these assumptions should be considered during FTA development:
- All failures are binary, meaning two states: operating or failed;
- Instantaneous transition between each state, meaning no delays;
- Statistically independent events;
- Constant failure rate;
- Equipment after a repair is as good as old, meaning after a repair, the equipment will be exactly at the same state before the failure occurred; there is no renewal process.
Birnbaum, Criticality and Fussell-Vesely Importance Measures
One of the desired outputs while performing an FTA is to identify event improvements that would maximize the performance of the system. The three importance measure methods typically used are Birnbaum, criticality and Fussell-Vesely. These methods allow for basic events identification with the highest importance measure value. The differences between the three are:
- Birnbaum is based on the top event probability variation between a scenario where a basic event has failed and another scenario where the same basic event has succeeded.
- Criticality is based on the probability that the top event is a result of the occurrence of a specific basic event.
- Fussell-Vesely is based on the probability that an event, not necessarily critical, has contributed to the top event’s probability, based on MOCUS.
Method selection should consider the following:
Birnbaum: Improvement efforts to increase availability are similar and can be applied to any basic event;
Criticality: Improvement efforts can be applied only to the most basic critical events or when the objective is to prioritize maintenance efforts;
Fussell-Vesely: When the objective is to minimize the contribution of each basic event.

Figure 2: FTA example with cut sets
Cut Sets and Minimal Cut Sets
A cut set is a set of basic events whose occurrence would trigger a top event. A minimal cut set is a combination of basic events that trigger the top event. Minimal cut sets are used to calculate probabilities of events and, consequently, the top event’s probability or frequency. The probability of the top event is calculated based on the probability of the Boolean sum of the minimal cut sets’ probabilities. The cut sets for the previous Figure 1 are represented by {A} and {B}.
The following sections exemplify the cut sets and minimum cut sets calculation for the FTA provided in Figure 2, which includes the Boolean equation solution.
Definition of the Cut Sets
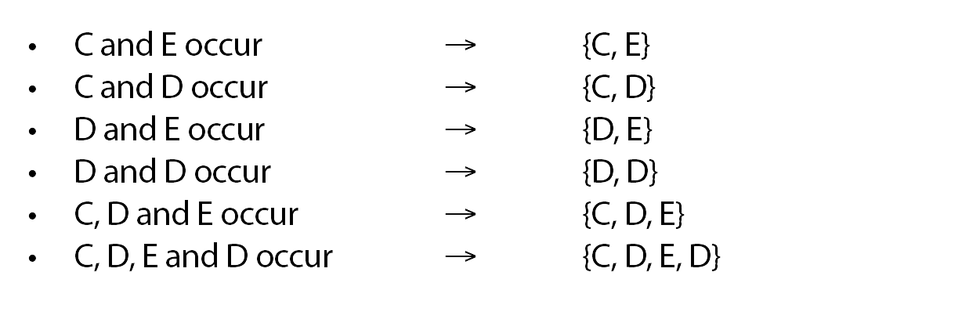
The top event P is triggered if the following combination of events occurs:

Using the correct representation of cut sets, Boolean simplification (numbers 4 and 6 in the following list) and super cut sets would look like this:

Top Event Probability Based on Minimum Cut Sets
The top event probability is calculated as follows:
- Combine basic events within minimal cut sets using an AND gate.
- Combine minimal cut sets using an OR gate.

Event Sensitivity
Event sensitivity using Birnbaum, criticality and Fussell-Vesely is used to evaluate the basic event criticality to the top event probability. This is performed following these tasks:
- Calculate the top event frequency assuming the one basic event has completely failed (P=1).
- Calculate the top event frequency assuming the one basic event is operating (P=0).
- Repeat task numbers 1 and 2 for each basic event.
- Calculate the Birnbaum factor, which is obtained from the difference in results in task numbers 1 and 2.
- Calculate the Fussell-Vesely factor, which is the product between the failure rate of the basic event and the Birnbaum factor.
- Normalize the Fussell-Vesely factor to obtain the event’s sensitivity.

Table 1 shows event sensitivity results considering the probability values displayed in the previous section.
The event sensitivity assessment shows that basic event D has the highest significance (54.01 percent) to the top event’s occurrence, while basic events C and E have nearly half the significance (22.99 percent) when compared to event D and both C and E contribute equally to the top event’s occurrence.
Cut Sets Criticality
Cut set criticality evaluates the influence of each cut set in the top event’s probability. This is performed following these tasks:
- Calculate the failure probability of each cut set.
- Calculate the proportion between the failure probability of each cut set and the top event.
Table 2 shows the results for the cut set criticality.

The cut set’s criticality assessment shows that the minimum cut set {D} has an 86.39 percent criticality, while the minimum cut set {C, E} is 68.03 percent.
Advantages of MOCUS
An FTA’s top event can be calculated considering different methods, such as Boolean mathematics, Monte Carlo simulation, Markov chain, MOCUS, etc. Depending on the complexity of the FTA, Monte Carlo methods might take excessive amounts of effort to achieve convergence. Boolean math might become too complex to solve and Markov chain might not be adequate to consider all types of failures.
As demonstrated, MOCUS is a deterministic solution that requires less computer efforts to calculate the top event’s probability or frequency, thus reducing error probability and taking less time to obtain the results.
References
1.U.S. Nuclear Regulatory Commission. Fault Tree Handbook. Washington, D.C.: Systems and Reliability Research, Office of Nuclear Regulatory Research, January 1981; https://www.nrc.gov/docs/ML1007/ML100780465.pdf
2.American Institute of Chemical Engineers Center for Chemical Process Safety, https://www.aiche.org/ccps