One of the more interesting perks of working as a reliability engineer, in my opinion, is getting to be part of the capital planning process. It never gets off the ground if you don’t have a complete asset register with relevant datasets, but it tends to be the area where executives will listen to the story your data tells. Working for an organization that has a very large global portfolio of both industrial and office space, I had the opportunity to demonstrate the power of data-driven decisions. Historically, each region in this portfolio received a capital budget based on previous year expenditures—a method that incentivized overspending to maximize next year’s budget and discouraged cost savings. It also encouraged requesting excessive capital projects and often resulted in regions vying against one another for funding in a capital catfight.
The Solution
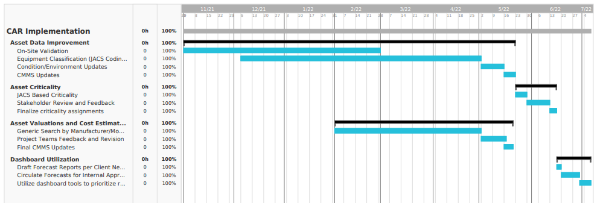
Although capital planning can be a multifaceted process, some of the root concepts are not complex. The first (and longest) step in any good capital planning program is asset validation. Like real estate touts the importance location, capital planning’s greatest value is in asset validation, asset validation, asset validation. Assuming you have a complete asset register with all the relevant details, the equipment then needs to be classified into relevant categories such that you can achieve a level of granularity that will distinguish between significant differences in replacement costs, operating environments, estimated useful life, and risks to business continuity or personal/environmental safety. From Figure 1, you can see that these pieces of the process are the bulk of the work in setting up a data driven asset replacement program.

Figure 1: Timeline of implementation for data analytics dashboard for six major sites
Once you have reasonable confidence in your asset register and you have the pertinent data needed to prioritize asset replacement, you can utilize industry standards or historical data to track estimated useful life for the asset types. Combining all these data points together will give you a maintenance backlog, along with risk factors of deferring any asset replacements. A cross-functional group of operations, engineering, and project teams worked together to define the risk categories in Figure 2.
 Figure 2: Risk categories for asset replacement prioritization
The Result
The result of this exercise was a very eye-opening picture of the health of each of their facilities, worldwide. Although capital spending and tribal knowledge had already painted some of this picture, seeing the unbiased data, with measurable cost and objective prioritization indicated a severe imbalance of previous fiscal year investment strategies. The client could now see with data that regions in Asia had been receiving far more capital investment than necessary, and that critical sites in American regions were at high risk of asset failures. We used this data to recommend a baseline investment strategy for each of their regional portfolios, and to build even more data-driven analysis into project requests. We were also able to use the prioritization matrix to safely defer $6,000,000 of projects, as well as reallocate another $4,000,000 to the appropriate project funding.


 Figure 2: Risk categories for asset replacement prioritization